Physical Therapist Hourly Pay in Gilbert, AZ: $52.13 (2026)
Quick Answer:Hourly pay for a physical therapist working in Gilbert, AZ runs $52.13 at the median for 2026 — annualizing to $108,440 at a standard 2,080-hour year. Figures projected from BLS OEWS 2025 (SOC 29-1123). Weighted against Gilbert's regional price level (BEA RPP 98.5, 1% below national), each hour of work buys what $52.93 nationally would. A 24-hour part-time schedule grosses $65,060 per year.
Based on BLS state-level estimates · View source
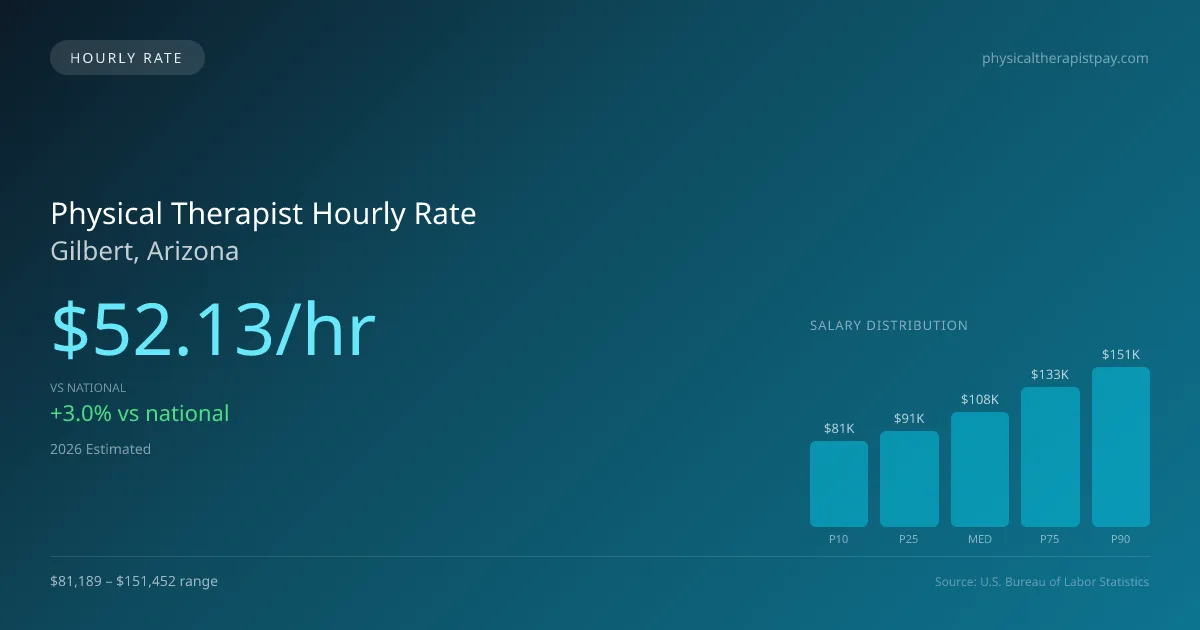
In Gilbert, AZ, the 2026 projected median physical therapist hourly pay stands at $52.13, notably higher than the national hourly median of $50.62. This competitive rate allows for flexible opportunities for part-time and per-diem positions within various settings such as outpatient clinics, hospital rehabilitation units, and home health visits. The hourly rate for physical therapists in Gilbert reflects a range from $39.04 for entry-level positions to $72.82 for those at the top of the pay scale. These figures, derived from annual salary projections, indicate that both new graduates and seasoned professionals can find lucrative roles in a vibrant healthcare market.
About the Gilbert Market
Salary estimated from Arizona average ($95,000) adjusted for local cost of living.
Physical Therapist Hourly Wage Breakdown
| Percentile | Hourly Rate | Per 8hr Shift |
|---|---|---|
| Entry Level (P10) | $39.04 | $312.30 |
| Lower Range (P25) | $43.67 | $349.35 |
| Median (P50) | $52.13 | $417.05 |
| Upper Range (P75) | $63.82 | $510.58 |
| Top Earners (P90) | $72.82 | $582.55 |
Estimated Annual Income by Work Schedule in Gilbert
Based on $52.13/hr median hourly rate · 2026 est.
At $52.13/hr, a physical therapist working full-time (40 hr/wk) in Gilbert, AZ can expect to earn approximately $108,434 per year (2026 est.). Part-time hygienists working 24 hours per week would earn around $62,558. With a cost-of-living index of 98.50 (below the national average), these earnings stretch further in Gilbert.
Hourly Rate Calculator
Schedule Comparison in Gilbert
| Schedule | Weekly | Monthly | Annual |
|---|---|---|---|
| Full-Time (40 hrs) | $2,085.27 | $9,036 | $108,434 |
| Part-Time (24 hrs) | $1,251.16 | $5,422 | $65,060 |
| Per Diem (16 hrs) | $834.11 | $3,614 | $43,374 |
Compare PT Wages With Similar Roles
| Role | Median Hourly |
|---|---|
| Physical Therapist (Gilbert) | $52.13 |
| Physical Therapist Assistant (National Avg) | $31.26 |
| Occupational Therapist (National Avg) | $47.00 |
| Chiropractor (National Avg) | $36.85 |
| Exercise Physiologist (National Avg) | $26.75 |
Physical Therapists in Gilbert, AZ earn a median of $108,440 per year (2026 est.), which is 2.99% higher than the national median of $105,288 and 2.50% above the Arizona state average of $105,795.
Physical Therapist Hourly Pay vs. Cost of Living
Working 24h/week at $52.13/hr = $65,060/year (purchasing power: $66,051).
Working 40h/week (full-time) = $108,434/year (purchasing power: $110,085).
CoL index: 98.5 (100 = national average). Your dollars stretch further here.
2019 BLS Actual
$44.28/hr
2025 BLS Actual
$50.88/hr
2026 Current Est.
$52.13/hr
2019–2027 Growth
+20.6%
Hourly Rate Trajectory for Physical Therapists in Gilbert (2019–2027)
2019–2025: actual BLS OEWS data for this metro area. 2026+: CAGR 2.46% projection.
| Year | Hourly Rate | Status |
|---|---|---|
| 2019 | $44.28/hr | Actual |
| 2020 | $45.06/hr | Actual |
| 2021 | $47.34/hr | Actual |
| 2022 | $48.38/hr | Actual |
| 2023 | $49.37/hr | Actual |
| 2024 | $46.13/hr | Actual |
| 2025 | $50.88/hr | Actual |
| 2026(current) | $52.13/hr | Estimated |
| 2027 | $53.41/hr | Projected |
Based on 7 years of BLS OEWS metropolitan area data, the median hourly rate for physical therapists in Gilbert grew 14.9% from $44.28/hr (2019) to $50.88/hr (2025). At a 2.46% projected growth rate, hourly pay is expected to reach $53.41/hr by 2027. Part-time and per-diem physical therapists can use this multi-year trend to benchmark future contract negotiations.
Note: Historical values (2019–2025) are actual BLS OEWS figures for the Gilbert metropolitan area, sourced from annual Occupational Employment and Wage Statistics surveys. 2026–2026 figures are current estimates, and 2027 values are projections, calculated using a 2.46% CAGR derived from 7-year BLS historical data. Actual salaries may vary based on employer, experience, certifications, and local market conditions.
Working as an Hourly Physical Therapist in Gilbert
For those considering part-time work, a physical therapist working three days a week could take home significantly less than a full-time colleague, potentially earning around $55,145 annually if they maintain a schedule of approximately 24 hours each week. Per diem physical therapists, on the other hand, typically see pay ranging from $50 to $75 per hour, with travel contracts fetching weekly earnings of $1,800 to $2,800. Specialized cash-pay models in HCOL markets can command between $150 and $250 hourly, especially in sports and orthopedic settings. Variability in hourly rates across employer types in Gilbert—such as outpatient orthopedic clinics, skilled nursing facilities, and home health agencies—creates a unique earnings landscape. Furthermore, some physical therapists may prioritize jobs with lower hourly rates that offer healthcare benefits over those with higher pay but no benefits. Negotiating techniques can be vital, so being informed about the local pay trends and demonstrating value through productivity or specialized skills may enhance compensation discussions for those entering or transitioning in Gilbert’s physical therapy market.
More salary data for Gilbert, AZ:
Frequently Asked Questions
What is the hourly rate for physical therapists in Gilbert in 2026?
How much do part-time physical therapists make in Gilbert?
Are physical therapists in Gilbert paid hourly or salary?
How much does a full-time physical therapist make per year in Gilbert?
Do physical therapists earn more per hour working part-time in Gilbert?
Related Pages
Compare Salaries
Career Resources
Nearby Cities in Arizona
Written by Alex Morgan, DPT
Career Analyst
Alex Morgan has over 10 years of experience in physical therapy. They specialize in orthopedic rehabilitation. Alex works in a private practice setting.
Methodology & Data Source
Hourly wage figures on this page are 2026 projections based on the Bureau of Labor Statistics Occupational Employment and Wage Statistics (OEWS) survey, May 2026 release. A 2.46% compound annual growth rate (CAGR), derived from 6-year national BLS wage trends, was applied to estimate current 2026 hourly rates for physical therapists in Gilbert. Part-time and full-time income estimates assume consistent weekly hours and do not account for overtime, benefits, or seasonal variation.
Data Sources & Methodology
Salary data for Gilbert is estimated from official BLS state-level occupational wage data (2025), adjusted for regional cost-of-living differences using BEA RPP (Regional Price Parities).
2026 figures are projected from 2025 BLS data using a compound annual growth rate (CAGR) of 2.46%, derived from historical BLS wage trends for physical therapists (SOC 29-1123).
Compiled and verified by Alex Morgan, DPT, a licensed physical therapist with 10+ years of clinical experience. · View source data at BLS.gov