Physical Therapist Hourly Pay in Milpitas, CA: $59.99 (2026)
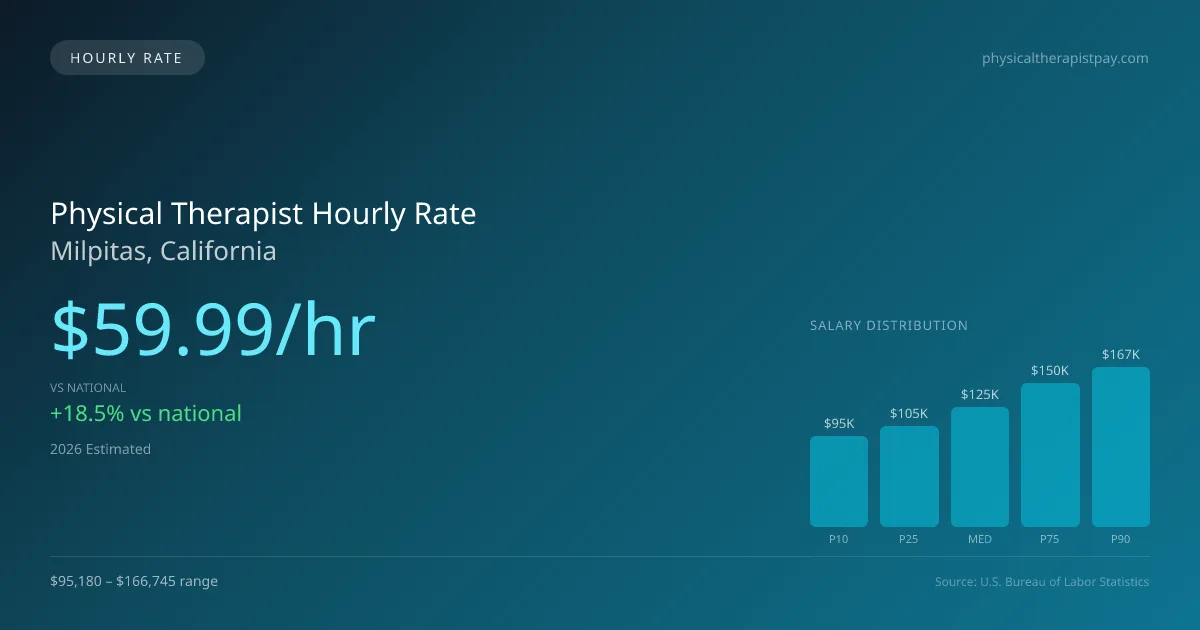
Quick Answer:Hourly pay for a physical therapist working in Milpitas, CA runs $59.99 at the median for 2026 — annualizing to $124,781 at a standard 2,080-hour year. Figures projected from BLS OEWS 2025 (SOC 29-1123). Weighted against Milpitas's regional price level (BEA RPP 113.1, 13% above national), each hour of work buys what $53.04 nationally would. A 24-hour part-time schedule grosses $74,868 per year.
Based on BLS state-level estimates · View source
With a significant hourly median of $59.99, physical therapist hourly pay in Milpitas, CA, outpaces the national average of $50.62. This higher compensation reflects the area's cost of living and demand for healthcare professionals, making it an attractive place for those in the field. For part-time physical therapists working three days a week, this hourly rate translates to a solid income, which is especially appealing for individuals seeking flexibility. In terms of per-diem work, therapists find various settings available, including outpatient clinics and skilled nursing facilities, where hourly rates can fall between $45.76 and $80.16. This range offers opportunities for both entry-level employees and seasoned professionals, ensuring that those in the top tier can maximize their earnings while working in a variety of clinical environments.
About the Milpitas Market
Salary estimated from California average ($109,000) adjusted for local cost of living.
Physical Therapist Hourly Wage Breakdown
| Percentile | Hourly Rate | Per 8hr Shift |
|---|---|---|
| Entry Level (P10) | $45.76 | $366.07 |
| Lower Range (P25) | $50.40 | $403.20 |
| Median (P50) | $59.99 | $479.92 |
| Upper Range (P75) | $71.95 | $575.58 |
| Top Earners (P90) | $80.16 | $641.32 |
Estimated Annual Income by Work Schedule in Milpitas
Based on $59.99/hr median hourly rate · 2026 est.
At $59.99/hr, a physical therapist working full-time (40 hr/wk) in Milpitas, CA can expect to earn approximately $124,780 per year (2026 est.). Part-time hygienists working 24 hours per week would earn around $71,988. With a cost-of-living index of 113.10 (above the national average), these earnings may be offset by higher expenses in Milpitas.
Hourly Rate Calculator
Schedule Comparison in Milpitas
| Schedule | Weekly | Monthly | Annual |
|---|---|---|---|
| Full-Time (40 hrs) | $2,399.61 | $10,398 | $124,780 |
| Part-Time (24 hrs) | $1,439.77 | $6,239 | $74,868 |
| Per Diem (16 hrs) | $959.85 | $4,159 | $49,912 |
Compare PT Wages With Similar Roles
| Role | Median Hourly |
|---|---|
| Physical Therapist (Milpitas) | $59.99 |
| Physical Therapist Assistant (National Avg) | $31.26 |
| Occupational Therapist (National Avg) | $47.00 |
| Chiropractor (National Avg) | $36.85 |
| Exercise Physiologist (National Avg) | $26.75 |
Physical Therapists in Milpitas, CA earn a median of $124,781 per year (2026 est.), which is 18.51% higher than the national median of $105,288 and 3.00% below the California state average of $128,640.
Physical Therapist Hourly Pay vs. Cost of Living
Working 24h/week at $59.99/hr = $74,868/year (purchasing power: $66,196).
Working 40h/week (full-time) = $124,780/year (purchasing power: $110,327).
CoL index: 113.1 (100 = national average).
2019 BLS Actual
$50.96/hr
2025 BLS Actual
$58.55/hr
2026 Current Est.
$59.99/hr
2019–2027 Growth
+20.6%
Hourly Rate Trajectory for Physical Therapists in Milpitas (2019–2027)
2019–2025: actual BLS OEWS data for this metro area. 2026+: CAGR 2.46% projection.
| Year | Hourly Rate | Status |
|---|---|---|
| 2019 | $50.96/hr | Actual |
| 2020 | $51.86/hr | Actual |
| 2021 | $54.48/hr | Actual |
| 2022 | $55.68/hr | Actual |
| 2023 | $56.81/hr | Actual |
| 2024 | $57.52/hr | Actual |
| 2025 | $58.55/hr | Actual |
| 2026(current) | $59.99/hr | Estimated |
| 2027 | $61.47/hr | Projected |
Based on 7 years of BLS OEWS metropolitan area data, the median hourly rate for physical therapists in Milpitas grew 14.9% from $50.96/hr (2019) to $58.55/hr (2025). At a 2.46% projected growth rate, hourly pay is expected to reach $61.47/hr by 2027. Part-time and per-diem physical therapists can use this multi-year trend to benchmark future contract negotiations.
Note: Historical values (2019–2025) are actual BLS OEWS figures for the Milpitas metropolitan area, sourced from annual Occupational Employment and Wage Statistics surveys. 2026–2026 figures are current estimates, and 2027 values are projections, calculated using a 2.46% CAGR derived from 7-year BLS historical data. Actual salaries may vary based on employer, experience, certifications, and local market conditions.
Working as an Hourly Physical Therapist in Milpitas
Part-time physical therapists in Milpitas can expect to earn approximately $74,992 annually based on a 24-hour workweek, translating to rewarding income that aligns with a balanced lifestyle. Meanwhile, per-diem physical therapist pay in Milpitas shows notable variation, with many billing between $50 and $75 per hour. Additionally, travel physical therapist contracts provide lucrative weekly earnings ranging from $1,800 to $2,800, inclusive of stipends, which can significantly enhance a therapist’s overall financial profile. Different employer types, such as outpatient orthopedic clinics and hospital systems, may also present varied hourly compensation, balancing benefits against pay rates. This compensation structure often leads physical therapists to weigh the pros and cons of accepting lower hourly rates in favor of employment benefits, such as health insurance. Successful negotiation remains essential, with local market trends allowing savvy therapists to command higher hourly rates, especially in specialized settings like sports medicine and pediatric clinics in Milpitas.
More salary data for Milpitas, CA:
Frequently Asked Questions
What is the hourly rate for physical therapists in Milpitas in 2026?
How much do part-time physical therapists make in Milpitas?
Are physical therapists in Milpitas paid hourly or salary?
How much does a full-time physical therapist make per year in Milpitas?
Do physical therapists earn more per hour working part-time in Milpitas?
Related Pages
Compare Salaries
Career Resources
Nearby Cities in California
Written by Alex Morgan, DPT
Career Analyst
Alex Morgan has over 10 years of experience in physical therapy. They specialize in orthopedic rehabilitation. Alex works in a private practice setting.
Methodology & Data Source
Hourly wage figures on this page are 2026 projections based on the Bureau of Labor Statistics Occupational Employment and Wage Statistics (OEWS) survey, May 2026 release. A 2.46% compound annual growth rate (CAGR), derived from 6-year national BLS wage trends, was applied to estimate current 2026 hourly rates for physical therapists in Milpitas. Part-time and full-time income estimates assume consistent weekly hours and do not account for overtime, benefits, or seasonal variation.
Data Sources & Methodology
Salary data for Milpitas is estimated from official BLS state-level occupational wage data (2025), adjusted for regional cost-of-living differences using BEA RPP (Regional Price Parities).
2026 figures are projected from 2025 BLS data using a compound annual growth rate (CAGR) of 2.46%, derived from historical BLS wage trends for physical therapists (SOC 29-1123).
Compiled and verified by Alex Morgan, DPT, a licensed physical therapist with 10+ years of clinical experience. · View source data at BLS.gov