Physical Therapist Hourly Pay in Napa, CA: $68.25 (2026)
Quick Answer:Hourly pay for a physical therapist working in Napa, CA runs $68.25 at the median for 2026 — annualizing to $141,948 at a standard 2,080-hour year. Figures projected from BLS OEWS 2025 (SOC 29-1123). Weighted against Napa's regional price level (BEA RPP 112.6, 13% above national), each hour of work buys what $60.64 nationally would. A 24-hour part-time schedule grosses $85,174 per year.
Official BLS data · View source
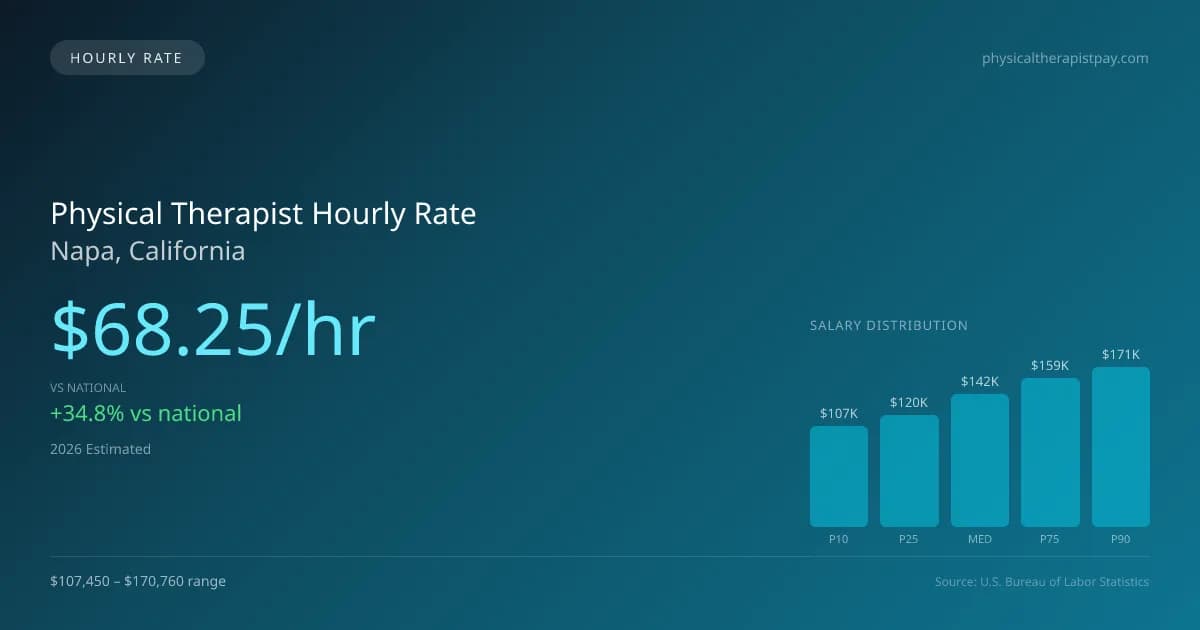
Physical therapists in Napa, California, enjoy a median hourly rate of $68.25, significantly higher than the national median of $50.62. This competitive pay structure provides substantial financial benefits for those seeking part-time or per-diem work in diverse settings, including outpatient clinics, rehabilitation units, skilled nursing facilities, and home health visits. Newer graduates might start at the lower end of the hourly range, earning around $51.66, while seasoned professionals can command rates up to $82.09 per hour. The data, sourced from the 2025 BLS OEWS projections for 2026, reflects the demand for physical therapists, suggesting a robust job market across Napa’s healthcare industry.
Physical Therapist Hourly Wage Breakdown
| Percentile | Hourly Rate | Per 8hr Shift |
|---|---|---|
| Entry Level (P10) | $51.66 | $413.28 |
| Lower Range (P25) | $57.63 | $461.07 |
| Median (P50) | $68.25 | $545.99 |
| Upper Range (P75) | $76.23 | $609.84 |
| Top Earners (P90) | $82.09 | $656.73 |
Estimated Annual Income by Work Schedule in Napa
Based on $68.25/hr median hourly rate · 2026 est.
At $68.25/hr, a physical therapist working full-time (40 hr/wk) in Napa, CA can expect to earn approximately $141,957 per year (2026 est.). Part-time hygienists working 24 hours per week would earn around $81,898. With a cost-of-living index of 112.55 (above the national average), these earnings may be offset by higher expenses in Napa.
Hourly Rate Calculator
Schedule Comparison in Napa
| Schedule | Weekly | Monthly | Annual |
|---|---|---|---|
| Full-Time (40 hrs) | $2,729.94 | $11,830 | $141,957 |
| Part-Time (24 hrs) | $1,637.97 | $7,098 | $85,174 |
| Per Diem (16 hrs) | $1,091.98 | $4,732 | $56,783 |
Compare PT Wages With Similar Roles
| Role | Median Hourly |
|---|---|
| Physical Therapist (Napa) | $68.25 |
| Physical Therapist Assistant (National Avg) | $31.26 |
| Occupational Therapist (National Avg) | $47.00 |
| Chiropractor (National Avg) | $36.85 |
| Exercise Physiologist (National Avg) | $26.75 |
Physical Therapists in Napa, CA earn a median of $141,948 per year (2026 est.), which is 34.82% higher than the national median of $105,288 and 10.40% above the California state average of $128,576.
Physical Therapist Hourly Pay vs. Cost of Living
Working 24h/week at $68.25/hr = $85,174/year (purchasing power: $75,674).
Working 40h/week (full-time) = $141,957/year (purchasing power: $126,124).
CoL index: 112.554 (100 = national average).
2019 BLS Actual
$42.97/hr
2025 BLS Actual
$66.61/hr
2026 Current Est.
$68.25/hr
2019–2027 Growth
+62.7%
Hourly Rate Trajectory for Physical Therapists in Napa (2019–2027)
2019–2025: actual BLS OEWS data for this metro area. 2026+: CAGR 2.46% projection.
| Year | Hourly Rate | Status |
|---|---|---|
| 2019 | $42.97/hr | Actual |
| 2020 | $54.82/hr | Actual |
| 2021 | $58.20/hr | Actual |
| 2022 | $61.64/hr | Actual |
| 2023 | $58.16/hr | Actual |
| 2024 | $61.90/hr | Actual |
| 2025 | $66.61/hr | Actual |
| 2026(current) | $68.25/hr | Estimated |
| 2027 | $69.93/hr | Projected |
Based on 7 years of BLS OEWS metropolitan area data, the median hourly rate for physical therapists in Napa grew 55.0% from $42.97/hr (2019) to $66.61/hr (2025). At a 2.46% projected growth rate, hourly pay is expected to reach $69.93/hr by 2027. Part-time and per-diem physical therapists can use this multi-year trend to benchmark future contract negotiations.
Note: Historical values (2019–2025) are actual BLS OEWS figures for the Napa metropolitan area, sourced from annual Occupational Employment and Wage Statistics surveys. 2026–2026 figures are current estimates, and 2027 values are projections, calculated using a 2.46% CAGR derived from 7-year BLS historical data. Actual salaries may vary based on employer, experience, certifications, and local market conditions.
Working as an Hourly Physical Therapist in Napa
For those considering part-time positions—working three days a week for approximately 24 hours—earnings can vary widely. A physical therapist in Napa might take home around $105,300 annually when working part-time, compared to a full-time rate. The per diem physical therapist pay in Napa typically ranges from $50 to $75 per hour, though traveling therapists often secure contracts that offer significantly more, spanning $1,800 to $2,800 per week. Employer types greatly influence hourly pay; for instance, outpatient orthopedic clinics generally offer lower rates than hospital systems, albeit with potential for productivity bonuses. Additionally, some therapists may choose to accept lower hourly rates for the security of health benefits associated with full-time positions. When negotiating, it's advisable for hourly workers to emphasize their unique skills or specialties, as specialized therapists in cash-pay settings can charge $150 to $250 per hour, which appeals to the growing trend toward direct-pay models within the industry.
More salary data for Napa, CA:
Frequently Asked Questions
What is the hourly rate for physical therapists in Napa in 2026?
How much do part-time physical therapists make in Napa?
Are physical therapists in Napa paid hourly or salary?
How much does a full-time physical therapist make per year in Napa?
Do physical therapists earn more per hour working part-time in Napa?
Related Pages
Compare Salaries
Career Resources
Nearby Cities in California
Written by Alex Morgan, DPT
Career Analyst
Alex Morgan has over 10 years of experience in physical therapy. They specialize in orthopedic rehabilitation. Alex works in a private practice setting.
Methodology & Data Source
Hourly wage figures on this page are 2026 projections based on the Bureau of Labor Statistics Occupational Employment and Wage Statistics (OEWS) survey, May 2026 release. A 2.46% compound annual growth rate (CAGR), derived from 6-year national BLS wage trends, was applied to estimate current 2026 hourly rates for physical therapists in Napa. Part-time and full-time income estimates assume consistent weekly hours and do not account for overtime, benefits, or seasonal variation.
Data Sources & Methodology
Source: BLS, OEWS, 7-year dataset (–). Per-city data from annual BLS metropolitan area surveys.
2026 figures are projected from 2025 BLS data using a compound annual growth rate (CAGR) of 2.46%, derived from historical BLS wage trends for physical therapists (SOC 29-1123).
Compiled and verified by Alex Morgan, DPT, a licensed physical therapist with 10+ years of clinical experience. · View source data at BLS.gov