Physical Therapist Hourly Pay in Newport Beach, CA: $60.47 (2026)
Quick Answer:Hourly pay for a physical therapist working in Newport Beach, CA runs $60.47 at the median for 2026 — annualizing to $125,779 at a standard 2,080-hour year. Figures projected from BLS OEWS 2025 (SOC 29-1123). Weighted against Newport Beach's regional price level (BEA RPP 113.1, 13% above national), each hour of work buys what $53.47 nationally would. A 24-hour part-time schedule grosses $75,469 per year.
Based on BLS state-level estimates · View source
In Newport Beach, physical therapists can expect a competitive hourly rate averaging $60.47, significantly higher than the national median of $50.62. This favorable pay scale provides substantial opportunities for part-time and per-diem physical therapists who often work in settings like outpatient clinics, skilled nursing facilities, and sports performance centers. With a pay range that spans from $46.89 at the lower tenth percentile to an impressive $79.70 for the top earners, even those who work three days a week can find themselves making a solid income. This ability to manage flexible schedules is particularly appealing in a city with a high cost of living, making the hourly pay an essential factor for professionals in this field.
About the Newport Beach Market
Salary estimated from California average ($109,000) adjusted for local cost of living.
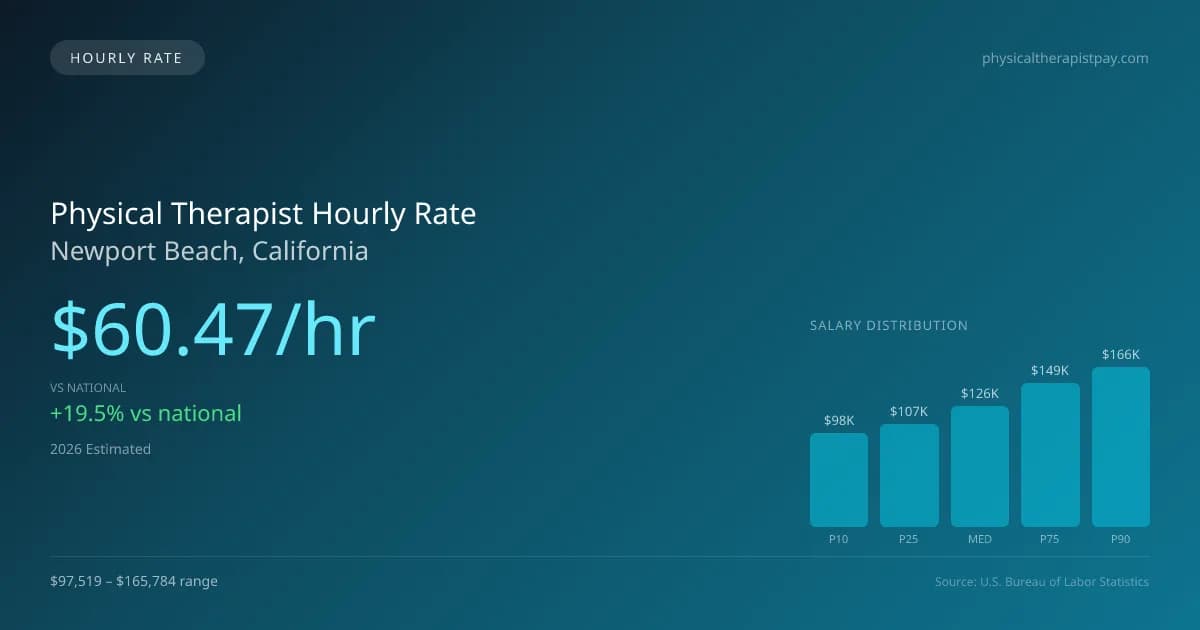
Physical Therapist Hourly Wage Breakdown
| Percentile | Hourly Rate | Per 8hr Shift |
|---|---|---|
| Entry Level (P10) | $46.89 | $375.09 |
| Lower Range (P25) | $51.36 | $410.91 |
| Median (P50) | $60.47 | $483.78 |
| Upper Range (P75) | $71.67 | $573.37 |
| Top Earners (P90) | $79.70 | $637.63 |
Estimated Annual Income by Work Schedule in Newport Beach
Based on $60.47/hr median hourly rate · 2026 est.
At $60.47/hr, a physical therapist working full-time (40 hr/wk) in Newport Beach, CA can expect to earn approximately $125,782 per year (2026 est.). Part-time hygienists working 24 hours per week would earn around $72,566. With a cost-of-living index of 113.10 (above the national average), these earnings may be offset by higher expenses in Newport Beach.
Hourly Rate Calculator
Schedule Comparison in Newport Beach
| Schedule | Weekly | Monthly | Annual |
|---|---|---|---|
| Full-Time (40 hrs) | $2,418.88 | $10,482 | $125,782 |
| Part-Time (24 hrs) | $1,451.33 | $6,289 | $75,469 |
| Per Diem (16 hrs) | $967.55 | $4,193 | $50,313 |
Compare PT Wages With Similar Roles
| Role | Median Hourly |
|---|---|
| Physical Therapist (Newport Beach) | $60.47 |
| Physical Therapist Assistant (National Avg) | $31.26 |
| Occupational Therapist (National Avg) | $47.00 |
| Chiropractor (National Avg) | $36.85 |
| Exercise Physiologist (National Avg) | $26.75 |
Physical Therapists in Newport Beach, CA earn a median of $125,779 per year (2026 est.), which is 19.46% higher than the national median of $105,288 and 2.20% below the California state average of $128,608.
Physical Therapist Hourly Pay vs. Cost of Living
Working 24h/week at $60.47/hr = $75,469/year (purchasing power: $66,728).
Working 40h/week (full-time) = $125,782/year (purchasing power: $111,213).
CoL index: 113.1 (100 = national average).
2019 BLS Actual
$51.37/hr
2025 BLS Actual
$59.02/hr
2026 Current Est.
$60.47/hr
2019–2027 Growth
+20.6%
Hourly Rate Trajectory for Physical Therapists in Newport Beach (2019–2027)
2019–2025: actual BLS OEWS data for this metro area. 2026+: CAGR 2.46% projection.
| Year | Hourly Rate | Status |
|---|---|---|
| 2019 | $51.37/hr | Actual |
| 2020 | $52.27/hr | Actual |
| 2021 | $54.92/hr | Actual |
| 2022 | $56.13/hr | Actual |
| 2023 | $57.27/hr | Actual |
| 2024 | $57.98/hr | Actual |
| 2025 | $59.02/hr | Actual |
| 2026(current) | $60.47/hr | Estimated |
| 2027 | $61.96/hr | Projected |
Based on 7 years of BLS OEWS metropolitan area data, the median hourly rate for physical therapists in Newport Beach grew 14.9% from $51.37/hr (2019) to $59.02/hr (2025). At a 2.46% projected growth rate, hourly pay is expected to reach $61.96/hr by 2027. Part-time and per-diem physical therapists can use this multi-year trend to benchmark future contract negotiations.
Note: Historical values (2019–2025) are actual BLS OEWS figures for the Newport Beach metropolitan area, sourced from annual Occupational Employment and Wage Statistics surveys. 2026–2026 figures are current estimates, and 2027 values are projections, calculated using a 2.46% CAGR derived from 7-year BLS historical data. Actual salaries may vary based on employer, experience, certifications, and local market conditions.
Working as an Hourly Physical Therapist in Newport Beach
For those considering part-time work, a physical therapist clocking in around 24 hours weekly can earn approximately $62,072 annually, demonstrating that a well-structured schedule still results in a respectable income. The per diem opportunities present even more variability, as therapists billing between $50 and $75 an hour can optimize their earnings based on demand and specialty. Travelers in this profession can command hefty contracts ranging from $1,800 to $2,800 a week, making the potential for lucrative compensation substantial. In Newport Beach, hourly rates vary widely depending on the employer type; private outpatient clinics tend to offer less compared to hospital inpatient and skilled nursing facilities. It's vital to consider the benefits trade-offs, as some therapists may accept lower hourly rates for comprehensive health plans versus higher pay without benefits. When negotiating hourly wages, being informed about local rates and industry standards is essential for ensuring a fair compensation package.
More salary data for Newport Beach, CA:
Frequently Asked Questions
What is the hourly rate for physical therapists in Newport Beach in 2026?
How much do part-time physical therapists make in Newport Beach?
Are physical therapists in Newport Beach paid hourly or salary?
How much does a full-time physical therapist make per year in Newport Beach?
Do physical therapists earn more per hour working part-time in Newport Beach?
Related Pages
Compare Salaries
Career Resources
Nearby Cities in California
Written by Alex Morgan, DPT
Career Analyst
Alex Morgan has over 10 years of experience in physical therapy. They specialize in orthopedic rehabilitation. Alex works in a private practice setting.
Methodology & Data Source
Hourly wage figures on this page are 2026 projections based on the Bureau of Labor Statistics Occupational Employment and Wage Statistics (OEWS) survey, May 2026 release. A 2.46% compound annual growth rate (CAGR), derived from 6-year national BLS wage trends, was applied to estimate current 2026 hourly rates for physical therapists in Newport Beach. Part-time and full-time income estimates assume consistent weekly hours and do not account for overtime, benefits, or seasonal variation.
Data Sources & Methodology
Salary data for Newport Beach is estimated from official BLS state-level occupational wage data (2025), adjusted for regional cost-of-living differences using BEA RPP (Regional Price Parities).
2026 figures are projected from 2025 BLS data using a compound annual growth rate (CAGR) of 2.46%, derived from historical BLS wage trends for physical therapists (SOC 29-1123).
Compiled and verified by Alex Morgan, DPT, a licensed physical therapist with 10+ years of clinical experience. · View source data at BLS.gov