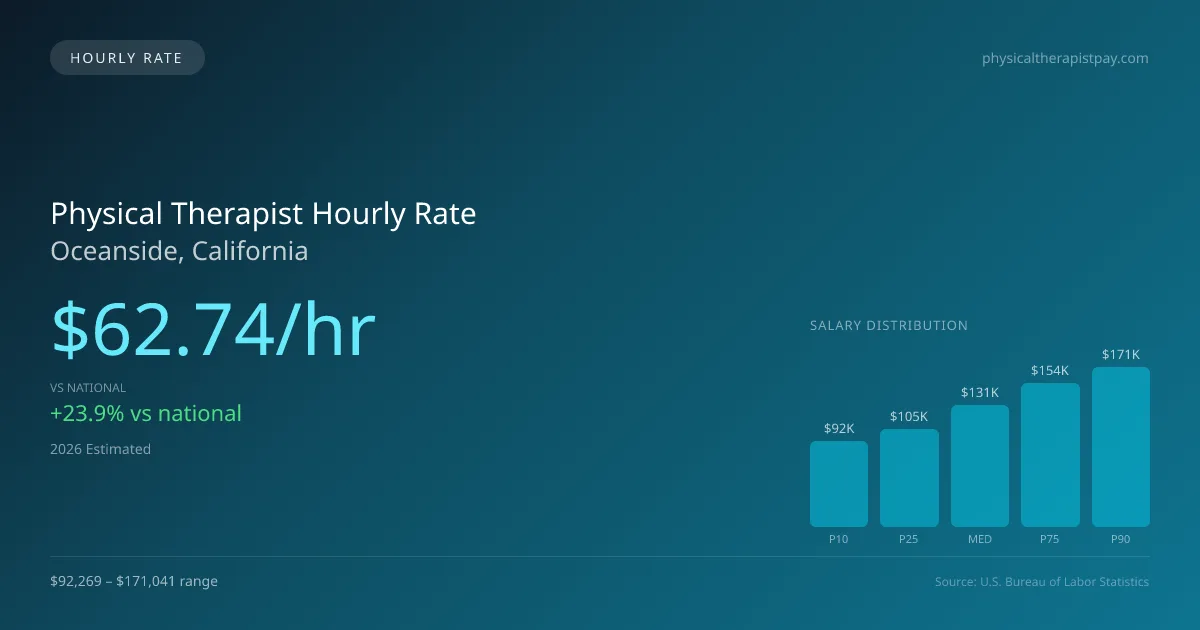
Physical Therapist Hourly Pay in Oceanside, CA: $62.74 (2026)
Quick Answer:Hourly pay for a physical therapist working in Oceanside, CA runs $62.74 at the median for 2026 — annualizing to $130,501 at a standard 2,080-hour year. Figures projected from BLS OEWS 2025 (SOC 29-1123). Weighted against Oceanside's regional price level (BEA RPP 113.1, 13% above national), each hour of work buys what $55.47 nationally would. A 24-hour part-time schedule grosses $78,295 per year.
Based on BLS state-level estimates · View source
In Oceanside, California, the physical therapist hourly pay is projected to be $62.74 in 2026, significantly surpassing the national median of $50.62 per hour. This premium rate reflects the higher cost of living in Southern California, making it an attractive option for both full-time and part-time practitioners. Part-time physical therapists working three days a week can still earn a competitive income, while per-diem professionals find flexibility and earning potential in various settings like outpatient clinics, skilled nursing facilities, and home health environments. The hourly rate in Oceanside ranges from $44.37 for entry-level positions to $82.23 for top earners, diverging from typical national trends and emphasizing the demand for skilled therapists in this coastal region.
About the Oceanside Market
Salary estimated from California average ($109,000) adjusted for local cost of living.
Physical Therapist Hourly Wage Breakdown
| Percentile | Hourly Rate | Per 8hr Shift |
|---|---|---|
| Entry Level (P10) | $44.37 | $354.92 |
| Lower Range (P25) | $50.30 | $402.38 |
| Median (P50) | $62.74 | $501.89 |
| Upper Range (P75) | $73.99 | $591.89 |
| Top Earners (P90) | $82.23 | $657.88 |
Estimated Annual Income by Work Schedule in Oceanside
Based on $62.74/hr median hourly rate · 2026 est.
At $62.74/hr, a physical therapist working full-time (40 hr/wk) in Oceanside, CA can expect to earn approximately $130,491 per year (2026 est.). Part-time hygienists working 24 hours per week would earn around $75,284. With a cost-of-living index of 113.10 (above the national average), these earnings may be offset by higher expenses in Oceanside.
Hourly Rate Calculator
Schedule Comparison in Oceanside
| Schedule | Weekly | Monthly | Annual |
|---|---|---|---|
| Full-Time (40 hrs) | $2,509.45 | $10,874 | $130,491 |
| Part-Time (24 hrs) | $1,505.67 | $6,525 | $78,295 |
| Per Diem (16 hrs) | $1,003.78 | $4,350 | $52,197 |
Compare PT Wages With Similar Roles
| Role | Median Hourly |
|---|---|
| Physical Therapist (Oceanside) | $62.74 |
| Physical Therapist Assistant (National Avg) | $31.26 |
| Occupational Therapist (National Avg) | $47.00 |
| Chiropractor (National Avg) | $36.85 |
| Exercise Physiologist (National Avg) | $26.75 |
Physical Therapists in Oceanside, CA earn a median of $130,501 per year (2026 est.), which is 23.95% higher than the national median of $105,288 and 1.50% above the California state average of $128,573.
Physical Therapist Hourly Pay vs. Cost of Living
Working 24h/week at $62.74/hr = $78,295/year (purchasing power: $69,226).
Working 40h/week (full-time) = $130,491/year (purchasing power: $115,377).
CoL index: 113.1 (100 = national average).
2019 BLS Actual
$53.29/hr
2025 BLS Actual
$61.23/hr
2026 Current Est.
$62.74/hr
2019–2027 Growth
+20.6%
Hourly Rate Trajectory for Physical Therapists in Oceanside (2019–2027)
2019–2025: actual BLS OEWS data for this metro area. 2026+: CAGR 2.46% projection.
| Year | Hourly Rate | Status |
|---|---|---|
| 2019 | $53.29/hr | Actual |
| 2020 | $54.23/hr | Actual |
| 2021 | $56.98/hr | Actual |
| 2022 | $58.23/hr | Actual |
| 2023 | $59.41/hr | Actual |
| 2024 | $60.16/hr | Actual |
| 2025 | $61.23/hr | Actual |
| 2026(current) | $62.74/hr | Estimated |
| 2027 | $64.28/hr | Projected |
Based on 7 years of BLS OEWS metropolitan area data, the median hourly rate for physical therapists in Oceanside grew 14.9% from $53.29/hr (2019) to $61.23/hr (2025). At a 2.46% projected growth rate, hourly pay is expected to reach $64.28/hr by 2027. Part-time and per-diem physical therapists can use this multi-year trend to benchmark future contract negotiations.
Note: Historical values (2019–2025) are actual BLS OEWS figures for the Oceanside metropolitan area, sourced from annual Occupational Employment and Wage Statistics surveys. 2026–2026 figures are current estimates, and 2027 values are projections, calculated using a 2.46% CAGR derived from 7-year BLS historical data. Actual salaries may vary based on employer, experience, certifications, and local market conditions.
Working as an Hourly Physical Therapist in Oceanside
When analyzing the financial prospects for physical therapists in Oceanside, part-time practitioners could anticipate an annual income that varies considerably based on their hours worked. For instance, a physical therapist working a 24-hour week would find themselves earning a respectable living, though still less than full-time counterparts. Per diem physical therapist pay in Oceanside typically ranges from $50 to $75 per hour, while travel contracts can offer lucrative weekly earnings of $1,800 to $2,800, including various stipends. The diversity of employment settings can also influence hourly rates; outpatient orthopedic clinics, leading hospital systems, and specialized therapy centers often have distinct compensation structures. Therapists might choose lower hourly pay for the security of benefits or opt for higher pay without insurance. Negotiating hourly rates is crucial, particularly in this competitive market, where understanding the prevailing rates and demonstrating value can give candidates an edge in securing favorable compensation.
More salary data for Oceanside, CA:
Frequently Asked Questions
What is the hourly rate for physical therapists in Oceanside in 2026?
How much do part-time physical therapists make in Oceanside?
Are physical therapists in Oceanside paid hourly or salary?
How much does a full-time physical therapist make per year in Oceanside?
Do physical therapists earn more per hour working part-time in Oceanside?
Related Pages
Compare Salaries
Career Resources
Nearby Cities in California
Written by Alex Morgan, DPT
Career Analyst
Alex Morgan has over 10 years of experience in physical therapy. They specialize in orthopedic rehabilitation. Alex works in a private practice setting.
Methodology & Data Source
Hourly wage figures on this page are 2026 projections based on the Bureau of Labor Statistics Occupational Employment and Wage Statistics (OEWS) survey, May 2026 release. A 2.46% compound annual growth rate (CAGR), derived from 6-year national BLS wage trends, was applied to estimate current 2026 hourly rates for physical therapists in Oceanside. Part-time and full-time income estimates assume consistent weekly hours and do not account for overtime, benefits, or seasonal variation.
Data Sources & Methodology
Salary data for Oceanside is estimated from official BLS state-level occupational wage data (2025), adjusted for regional cost-of-living differences using BEA RPP (Regional Price Parities).
2026 figures are projected from 2025 BLS data using a compound annual growth rate (CAGR) of 2.46%, derived from historical BLS wage trends for physical therapists (SOC 29-1123).
Compiled and verified by Alex Morgan, DPT, a licensed physical therapist with 10+ years of clinical experience. · View source data at BLS.gov