Physical Therapist Hourly Pay in Ontario, CA: $59.96 (2026)
Quick Answer:Hourly pay for a physical therapist working in Ontario, CA runs $59.96 at the median for 2026 — annualizing to $124,724 at a standard 2,080-hour year. Figures projected from BLS OEWS 2025 (SOC 29-1123). Weighted against Ontario's regional price level (BEA RPP 113.1, 13% above national), each hour of work buys what $53.01 nationally would. A 24-hour part-time schedule grosses $74,830 per year.
Based on BLS state-level estimates · View source
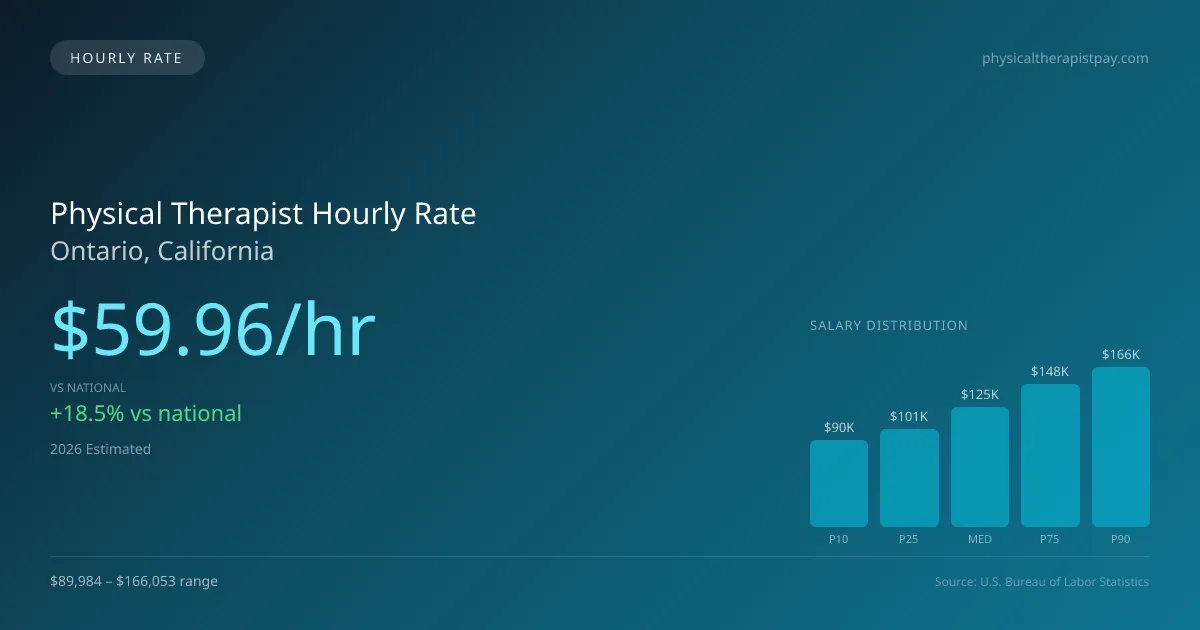
In Ontario, California, physical therapists command a median hourly pay of $59.96, significantly higher than the national median of $50.62. This premium reflects not just local economic conditions but also the diverse practice settings where these professionals work, such as outpatient clinics and skilled nursing facilities. For physical therapists working part-time, especially those on a schedule of three days a week, this rate can translate into a substantial income while allowing for a favorable work-life balance. The hourly pay range for physical therapists in Ontario spans from $43.26 for entry-level positions to $79.84 for top earners, providing flexibility for various roles and responsibilities within the field.
About the Ontario Market
Salary estimated from California average ($109,000) adjusted for local cost of living.
Physical Therapist Hourly Wage Breakdown
| Percentile | Hourly Rate | Per 8hr Shift |
|---|---|---|
| Entry Level (P10) | $43.26 | $346.07 |
| Lower Range (P25) | $48.68 | $389.43 |
| Median (P50) | $59.96 | $479.68 |
| Upper Range (P75) | $71.31 | $570.50 |
| Top Earners (P90) | $79.84 | $638.69 |
Estimated Annual Income by Work Schedule in Ontario
Based on $59.96/hr median hourly rate · 2026 est.
At $59.96/hr, a physical therapist working full-time (40 hr/wk) in Ontario, CA can expect to earn approximately $124,716 per year (2026 est.). Part-time hygienists working 24 hours per week would earn around $71,952. With a cost-of-living index of 113.10 (above the national average), these earnings may be offset by higher expenses in Ontario.
Hourly Rate Calculator
Schedule Comparison in Ontario
| Schedule | Weekly | Monthly | Annual |
|---|---|---|---|
| Full-Time (40 hrs) | $2,398.38 | $10,393 | $124,716 |
| Part-Time (24 hrs) | $1,439.03 | $6,236 | $74,830 |
| Per Diem (16 hrs) | $959.35 | $4,157 | $49,886 |
Compare PT Wages With Similar Roles
| Role | Median Hourly |
|---|---|
| Physical Therapist (Ontario) | $59.96 |
| Physical Therapist Assistant (National Avg) | $31.26 |
| Occupational Therapist (National Avg) | $47.00 |
| Chiropractor (National Avg) | $36.85 |
| Exercise Physiologist (National Avg) | $26.75 |
Physical Therapists in Ontario, CA earn a median of $124,724 per year (2026 est.), which is 18.46% higher than the national median of $105,288 and 3.00% below the California state average of $128,581.
Physical Therapist Hourly Pay vs. Cost of Living
Working 24h/week at $59.96/hr = $74,830/year (purchasing power: $66,162).
Working 40h/week (full-time) = $124,716/year (purchasing power: $110,271).
CoL index: 113.1 (100 = national average).
2019 BLS Actual
$50.93/hr
2025 BLS Actual
$58.52/hr
2026 Current Est.
$59.96/hr
2019–2027 Growth
+20.6%
Hourly Rate Trajectory for Physical Therapists in Ontario (2019–2027)
2019–2025: actual BLS OEWS data for this metro area. 2026+: CAGR 2.46% projection.
| Year | Hourly Rate | Status |
|---|---|---|
| 2019 | $50.93/hr | Actual |
| 2020 | $51.83/hr | Actual |
| 2021 | $54.45/hr | Actual |
| 2022 | $55.65/hr | Actual |
| 2023 | $56.78/hr | Actual |
| 2024 | $60.67/hr | Actual |
| 2025 | $58.52/hr | Actual |
| 2026(current) | $59.96/hr | Estimated |
| 2027 | $61.43/hr | Projected |
Based on 7 years of BLS OEWS metropolitan area data, the median hourly rate for physical therapists in Ontario grew 14.9% from $50.93/hr (2019) to $58.52/hr (2025). At a 2.46% projected growth rate, hourly pay is expected to reach $61.43/hr by 2027. Part-time and per-diem physical therapists can use this multi-year trend to benchmark future contract negotiations.
Note: Historical values (2019–2025) are actual BLS OEWS figures for the Ontario metropolitan area, sourced from annual Occupational Employment and Wage Statistics surveys. 2026–2026 figures are current estimates, and 2027 values are projections, calculated using a 2.46% CAGR derived from 7-year BLS historical data. Actual salaries may vary based on employer, experience, certifications, and local market conditions.
Working as an Hourly Physical Therapist in Ontario
Looking at the earning potential for part-time and per-diem physical therapists, many professionals may find themselves considering a 24-hour workweek. By working just three days a week at the median hourly rate, a physical therapist could expect to take home around $74,400 annually, which is fairly competitive but still less than what full-timers earn. Per-diem physical therapists often charge between $50-$75 per hour, while travel contracts can provide lucrative options, with weekly earnings reaching $1,800-$2,800, including stipends. Specialty practices, particularly in high-cost areas, can charge cash-pay rates of $150-$250 per hour for direct services. Hourly rates in Ontario can vary widely depending on the employer type, with outpatient orthopedic clinics, hospitals, and skilled nursing facilities offering different compensation models. Some therapists may choose lower hourly rates that come with benefits from stable employers over higher, yet benefit-free, rates in private practice settings. As hourly workers negotiate their pay, understanding local market conditions and emphasizing demand for specialized skills can significantly influence compensation outcomes.
More salary data for Ontario, CA:
Frequently Asked Questions
What is the hourly rate for physical therapists in Ontario in 2026?
How much do part-time physical therapists make in Ontario?
Are physical therapists in Ontario paid hourly or salary?
How much does a full-time physical therapist make per year in Ontario?
Do physical therapists earn more per hour working part-time in Ontario?
Related Pages
Compare Salaries
Career Resources
Nearby Cities in California
Written by Alex Morgan, DPT
Career Analyst
Alex Morgan has over 10 years of experience in physical therapy. They specialize in orthopedic rehabilitation. Alex works in a private practice setting.
Methodology & Data Source
Hourly wage figures on this page are 2026 projections based on the Bureau of Labor Statistics Occupational Employment and Wage Statistics (OEWS) survey, May 2026 release. A 2.46% compound annual growth rate (CAGR), derived from 6-year national BLS wage trends, was applied to estimate current 2026 hourly rates for physical therapists in Ontario. Part-time and full-time income estimates assume consistent weekly hours and do not account for overtime, benefits, or seasonal variation.
Data Sources & Methodology
Salary data for Ontario is estimated from official BLS state-level occupational wage data (2025), adjusted for regional cost-of-living differences using BEA RPP (Regional Price Parities).
2026 figures are projected from 2025 BLS data using a compound annual growth rate (CAGR) of 2.46%, derived from historical BLS wage trends for physical therapists (SOC 29-1123).
Compiled and verified by Alex Morgan, DPT, a licensed physical therapist with 10+ years of clinical experience. · View source data at BLS.gov