Physical Therapist Hourly Pay in Poway, CA: $60.84 (2026)
Quick Answer:Hourly pay for a physical therapist working in Poway, CA runs $60.84 at the median for 2026 — annualizing to $126,550 at a standard 2,080-hour year. Figures projected from BLS OEWS 2025 (SOC 29-1123). Weighted against Poway's regional price level (BEA RPP 113.1, 13% above national), each hour of work buys what $53.79 nationally would. A 24-hour part-time schedule grosses $75,929 per year.
Based on BLS state-level estimates · View source
In Poway, California, physical therapists earn a median hourly pay of $60.84, which significantly exceeds the national median of $50.62. This level of compensation offers substantial opportunities for part-time and per-diem therapists, particularly those working in diverse settings such as outpatient clinics, hospital rehab units, and even home health visits. For professionals working three days a week, this hourly rate translates into a robust income that is competitive in the local market. The hourly pay range extends from around $46.28 for entry-level positions to as much as $75.02 for seasoned professionals, allowing individuals to tailor their work arrangements to their lifestyle needs while still earning an attractive wage.
About the Poway Market
Salary estimated from California average ($109,000) adjusted for local cost of living.
Physical Therapist Hourly Wage Breakdown
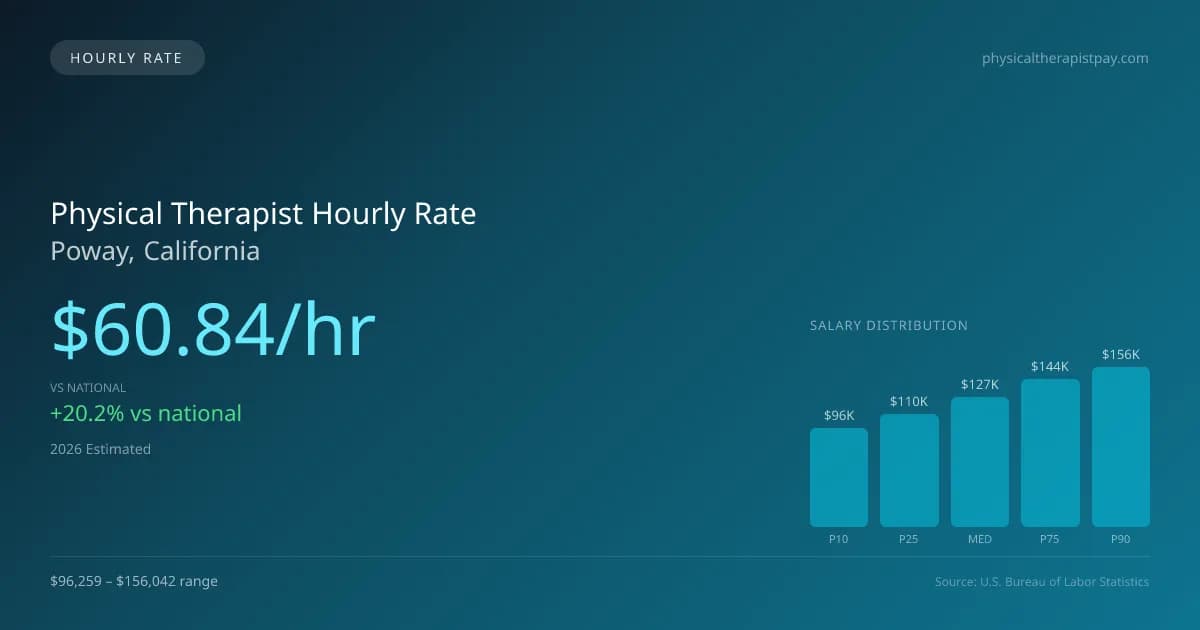
| Percentile | Hourly Rate | Per 8hr Shift |
|---|---|---|
| Entry Level (P10) | $46.28 | $370.25 |
| Lower Range (P25) | $53.09 | $424.76 |
| Median (P50) | $60.84 | $486.73 |
| Upper Range (P75) | $69.33 | $554.68 |
| Top Earners (P90) | $75.02 | $600.17 |
Estimated Annual Income by Work Schedule in Poway
Based on $60.84/hr median hourly rate · 2026 est.
At $60.84/hr, a physical therapist working full-time (40 hr/wk) in Poway, CA can expect to earn approximately $126,549 per year (2026 est.). Part-time hygienists working 24 hours per week would earn around $73,009. With a cost-of-living index of 113.10 (above the national average), these earnings may be offset by higher expenses in Poway.
Hourly Rate Calculator
Schedule Comparison in Poway
| Schedule | Weekly | Monthly | Annual |
|---|---|---|---|
| Full-Time (40 hrs) | $2,433.63 | $10,546 | $126,549 |
| Part-Time (24 hrs) | $1,460.18 | $6,327 | $75,929 |
| Per Diem (16 hrs) | $973.45 | $4,218 | $50,620 |
Compare PT Wages With Similar Roles
| Role | Median Hourly |
|---|---|
| Physical Therapist (Poway) | $60.84 |
| Physical Therapist Assistant (National Avg) | $31.26 |
| Occupational Therapist (National Avg) | $47.00 |
| Chiropractor (National Avg) | $36.85 |
| Exercise Physiologist (National Avg) | $26.75 |
Physical Therapists in Poway, CA earn a median of $126,550 per year (2026 est.), which is 20.19% higher than the national median of $105,288 and 1.60% below the California state average of $128,608.
Physical Therapist Hourly Pay vs. Cost of Living
Working 24h/week at $60.84/hr = $75,929/year (purchasing power: $67,135).
Working 40h/week (full-time) = $126,549/year (purchasing power: $111,891).
CoL index: 113.1 (100 = national average).
2019 BLS Actual
$51.68/hr
2025 BLS Actual
$59.38/hr
2026 Current Est.
$60.84/hr
2019–2027 Growth
+20.6%
Hourly Rate Trajectory for Physical Therapists in Poway (2019–2027)
2019–2025: actual BLS OEWS data for this metro area. 2026+: CAGR 2.46% projection.
| Year | Hourly Rate | Status |
|---|---|---|
| 2019 | $51.68/hr | Actual |
| 2020 | $52.59/hr | Actual |
| 2021 | $55.25/hr | Actual |
| 2022 | $56.47/hr | Actual |
| 2023 | $57.62/hr | Actual |
| 2024 | $58.33/hr | Actual |
| 2025 | $59.38/hr | Actual |
| 2026(current) | $60.84/hr | Estimated |
| 2027 | $62.34/hr | Projected |
Based on 7 years of BLS OEWS metropolitan area data, the median hourly rate for physical therapists in Poway grew 14.9% from $51.68/hr (2019) to $59.38/hr (2025). At a 2.46% projected growth rate, hourly pay is expected to reach $62.34/hr by 2027. Part-time and per-diem physical therapists can use this multi-year trend to benchmark future contract negotiations.
Note: Historical values (2019–2025) are actual BLS OEWS figures for the Poway metropolitan area, sourced from annual Occupational Employment and Wage Statistics surveys. 2026–2026 figures are current estimates, and 2027 values are projections, calculated using a 2.46% CAGR derived from 7-year BLS historical data. Actual salaries may vary based on employer, experience, certifications, and local market conditions.
Working as an Hourly Physical Therapist in Poway
Looking deeper into the earning potential, a physical therapist employed on a part-time basis in Poway, working 24 hours a week, could bring home an impressive annual figure, albeit less than their full-time counterparts who enjoy more benefits. While per diem physical therapists generally earn between $50 and $75 per hour, opportunities for travel PT contracts can yield even higher weekly payments, typically ranging from $1,800 to $2,800, plus stipends. Interestingly, the type of employer significantly impacts hourly rates; outpatient orthopedic clinics often pay less than hospital systems due to budget constraints, alongside differing salary models that prioritize productivity bonuses. For some, the decision comes down to accepting a lower hourly rate with included health insurance, while others might chase higher pay without benefits. To maximize earning potential, therapists negotiating salaries should consider the cost of living in Poway and tailor their asks based on experienced peers within the field.
More salary data for Poway, CA:
Frequently Asked Questions
What is the hourly rate for physical therapists in Poway in 2026?
How much do part-time physical therapists make in Poway?
Are physical therapists in Poway paid hourly or salary?
How much does a full-time physical therapist make per year in Poway?
Do physical therapists earn more per hour working part-time in Poway?
Related Pages
Compare Salaries
Career Resources
Nearby Cities in California
Written by Alex Morgan, DPT
Career Analyst
Alex Morgan has over 10 years of experience in physical therapy. They specialize in orthopedic rehabilitation. Alex works in a private practice setting.
Methodology & Data Source
Hourly wage figures on this page are 2026 projections based on the Bureau of Labor Statistics Occupational Employment and Wage Statistics (OEWS) survey, May 2026 release. A 2.46% compound annual growth rate (CAGR), derived from 6-year national BLS wage trends, was applied to estimate current 2026 hourly rates for physical therapists in Poway. Part-time and full-time income estimates assume consistent weekly hours and do not account for overtime, benefits, or seasonal variation.
Data Sources & Methodology
Salary data for Poway is estimated from official BLS state-level occupational wage data (2025), adjusted for regional cost-of-living differences using BEA RPP (Regional Price Parities).
2026 figures are projected from 2025 BLS data using a compound annual growth rate (CAGR) of 2.46%, derived from historical BLS wage trends for physical therapists (SOC 29-1123).
Compiled and verified by Alex Morgan, DPT, a licensed physical therapist with 10+ years of clinical experience. · View source data at BLS.gov