Physical Therapist Hourly Pay in Yuba City, CA: $52.51 (2026)
Quick Answer:Hourly pay for a physical therapist working in Yuba City, CA runs $52.51 at the median for 2026 — annualizing to $109,222 at a standard 2,080-hour year. Figures projected from BLS OEWS 2025 (SOC 29-1123). Weighted against Yuba City's regional price level (BEA RPP 104.2, 4% above national), each hour of work buys what $50.38 nationally would. A 24-hour part-time schedule grosses $65,533 per year.
Official BLS data · View source
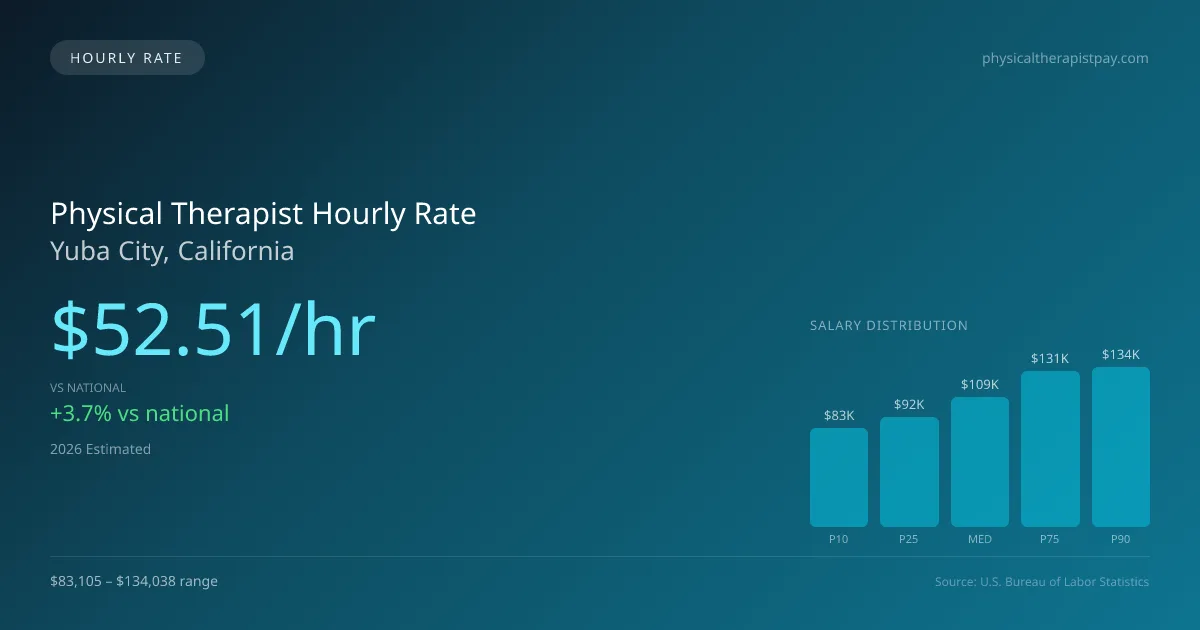
As of 2026, the physical therapist hourly pay in Yuba City is projected to be $52.51, which not only exceeds the national median of $50.62 but also places this city on the radar for competitive earnings in the physical therapy field. This hourly rate creates enticing opportunities for part-time and per-diem therapists working in various settings, such as outpatient clinics, inpatient rehabilitation centers, and home health environments. The range for entry-level positions begins at approximately $39.96 per hour, while experienced professionals can earn as much as $64.45 per hour. This data, derived from 2025 BLS OEWS, indicates that physical therapists in Yuba City enjoy a favorable compensation landscape compared to many other regions in California.
Physical Therapist Hourly Wage Breakdown
| Percentile | Hourly Rate | Per 8hr Shift |
|---|---|---|
| Entry Level (P10) | $39.96 | $319.68 |
| Lower Range (P25) | $44.19 | $353.53 |
| Median (P50) | $52.51 | $420.09 |
| Upper Range (P75) | $62.91 | $503.28 |
| Top Earners (P90) | $64.45 | $515.58 |
Estimated Annual Income by Work Schedule in Yuba City
Based on $52.51/hr median hourly rate · 2026 est.
At $52.51/hr, a physical therapist working full-time (40 hr/wk) in Yuba City, CA can expect to earn approximately $109,222 per year (2026 est.). Part-time hygienists working 24 hours per week would earn around $63,013. With a cost-of-living index of 104.23 (above the national average), these earnings may be offset by higher expenses in Yuba City.
Hourly Rate Calculator
Schedule Comparison in Yuba City
| Schedule | Weekly | Monthly | Annual |
|---|---|---|---|
| Full-Time (40 hrs) | $2,100.43 | $9,102 | $109,222 |
| Part-Time (24 hrs) | $1,260.26 | $5,461 | $65,533 |
| Per Diem (16 hrs) | $840.17 | $3,641 | $43,689 |
Compare PT Wages With Similar Roles
| Role | Median Hourly |
|---|---|
| Physical Therapist (Yuba City) | $52.51 |
| Physical Therapist Assistant (National Avg) | $31.26 |
| Occupational Therapist (National Avg) | $47.00 |
| Chiropractor (National Avg) | $36.85 |
| Exercise Physiologist (National Avg) | $26.75 |
Physical Therapists in Yuba City, CA earn a median of $109,222 per year (2026 est.), which is 3.74% higher than the national median of $105,288 and 15.10% below the California state average of $128,648.
Physical Therapist Hourly Pay vs. Cost of Living
Working 24h/week at $52.51/hr = $65,533/year (purchasing power: $62,872).
Working 40h/week (full-time) = $109,222/year (purchasing power: $104,787).
CoL index: 104.233 (100 = national average).
2019 BLS Actual
$54.77/hr
2025 BLS Actual
$51.25/hr
2026 Current Est.
$52.51/hr
2019–2027 Growth
+-1.8%
Hourly Rate Trajectory for Physical Therapists in Yuba City (2019–2027)
2019–2025: actual BLS OEWS data for this metro area. 2026+: CAGR 2.46% projection.
| Year | Hourly Rate | Status |
|---|---|---|
| 2019 | $54.77/hr | Actual |
| 2020 | $53.00/hr | Actual |
| 2021 | $49.07/hr | Actual |
| 2022 | $50.69/hr | Actual |
| 2023 | $52.34/hr | Actual |
| 2024 | $54.45/hr | Actual |
| 2025 | $51.25/hr | Actual |
| 2026(current) | $52.51/hr | Estimated |
| 2027 | $53.80/hr | Projected |
Based on 7 years of BLS OEWS metropolitan area data, the median hourly rate for physical therapists in Yuba City grew -6.4% from $54.77/hr (2019) to $51.25/hr (2025). At a 2.46% projected growth rate, hourly pay is expected to reach $53.80/hr by 2027. Part-time and per-diem physical therapists can use this multi-year trend to benchmark future contract negotiations.
Note: Historical values (2019–2025) are actual BLS OEWS figures for the Yuba City metropolitan area, sourced from annual Occupational Employment and Wage Statistics surveys. 2026–2026 figures are current estimates, and 2027 values are projections, calculated using a 2.46% CAGR derived from 7-year BLS historical data. Actual salaries may vary based on employer, experience, certifications, and local market conditions.
Working as an Hourly Physical Therapist in Yuba City
The earning potential changes significantly for professionals opting for part-time or per-diem work. A physical therapist working just three days a week could see annual earnings of around $61,050 based on a 24-hour workweek, a considerable figure compared to full-time salaries. Per diem physical therapists frequently charge between $50 and $75 per hour, while travel contracts can yield $1,800 to $2,800 per week, often including stipends that add to total earnings. Additionally, specialized therapists in cash-pay models may bill directly at rates of $150 to $250 per hour, particularly in high-cost markets. However, these figures can vary across different employer types in Yuba City; outpatient orthopedic clinics may offer lower rates than hospital systems. Therapists might face a trade-off between higher hourly rates without benefits and lower rates that include health insurance. To negotiate effectively, understanding local market rates and being clear about preferred working conditions can provide leverage for those securing contracts in this competitive field.
More salary data for Yuba City, CA:
Frequently Asked Questions
What is the hourly rate for physical therapists in Yuba City in 2026?
How much do part-time physical therapists make in Yuba City?
Are physical therapists in Yuba City paid hourly or salary?
How much does a full-time physical therapist make per year in Yuba City?
Do physical therapists earn more per hour working part-time in Yuba City?
Related Pages
Compare Salaries
Career Resources
Nearby Cities in California
Written by Alex Morgan, DPT
Career Analyst
Alex Morgan has over 10 years of experience in physical therapy. They specialize in orthopedic rehabilitation. Alex works in a private practice setting.
Methodology & Data Source
Hourly wage figures on this page are 2026 projections based on the Bureau of Labor Statistics Occupational Employment and Wage Statistics (OEWS) survey, May 2026 release. A 2.46% compound annual growth rate (CAGR), derived from 6-year national BLS wage trends, was applied to estimate current 2026 hourly rates for physical therapists in Yuba City. Part-time and full-time income estimates assume consistent weekly hours and do not account for overtime, benefits, or seasonal variation.
Data Sources & Methodology
Source: BLS, OEWS, 7-year dataset (–). Per-city data from annual BLS metropolitan area surveys.
2026 figures are projected from 2025 BLS data using a compound annual growth rate (CAGR) of 2.46%, derived from historical BLS wage trends for physical therapists (SOC 29-1123).
Compiled and verified by Alex Morgan, DPT, a licensed physical therapist with 10+ years of clinical experience. · View source data at BLS.gov