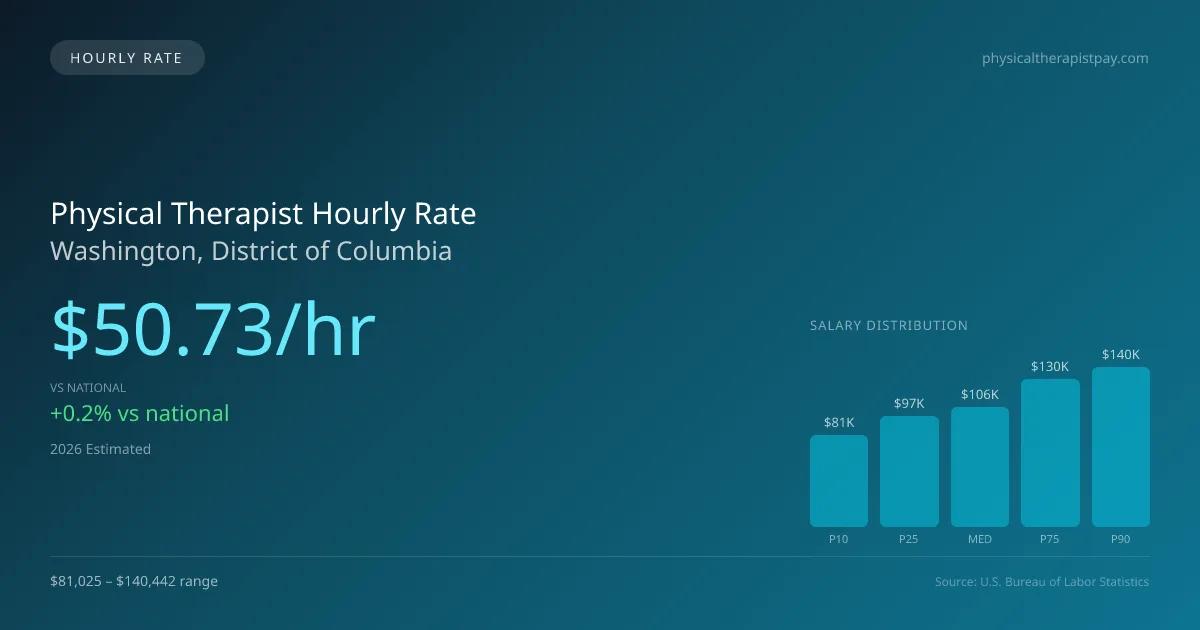
Physical Therapist Hourly Pay in Washington, DC: $50.73 (2026)
Quick Answer:Hourly pay for a physical therapist working in Washington, DC runs $50.73 at the median for 2026 — annualizing to $105,513 at a standard 2,080-hour year. Figures projected from BLS OEWS 2025 (SOC 29-1123). Weighted against Washington's regional price level (BEA RPP 108.9, 9% above national), each hour of work buys what $46.59 nationally would. A 24-hour part-time schedule grosses $63,308 per year.
Official BLS data · View source
Physical therapists in Washington, DC, can expect to earn a median hourly rate of $50.73 in 2026, slightly above the national median of $50.62. This competitive hourly pay allows for a range of employment options for both full-time and part-time professionals in various settings such as outpatient clinics, hospitals, skilled nursing facilities, sports performance centers, and even home health. With an hourly range spanning from $38.96 for entry-level roles to $67.52 for top earners, there is ample opportunity for therapists to find a position that fits their career goals and lifestyle, whether they are working three days a week or engaging in per-diem assignments. The data presented here is based on 2025 BLS OEWS data, projected to 2026, providing insight into the expected compensation landscape for physical therapists in Washington.
Physical Therapist Hourly Wage Breakdown
| Percentile | Hourly Rate | Per 8hr Shift |
|---|---|---|
| Entry Level (P10) | $38.96 | $311.64 |
| Lower Range (P25) | $46.64 | $373.12 |
| Median (P50) | $50.73 | $405.82 |
| Upper Range (P75) | $62.57 | $500.58 |
| Top Earners (P90) | $67.52 | $540.17 |
Estimated Annual Income by Work Schedule in Washington
Based on $50.73/hr median hourly rate · 2026 est.
At $50.73/hr, a physical therapist working full-time (40 hr/wk) in Washington, DC can expect to earn approximately $105,514 per year (2026 est.). Part-time hygienists working 24 hours per week would earn around $60,874. With a cost-of-living index of 108.88 (above the national average), these earnings may be offset by higher expenses in Washington.
Hourly Rate Calculator
Schedule Comparison in Washington
| Schedule | Weekly | Monthly | Annual |
|---|---|---|---|
| Full-Time (40 hrs) | $2,029.12 | $8,793 | $105,514 |
| Part-Time (24 hrs) | $1,217.47 | $5,276 | $63,308 |
| Per Diem (16 hrs) | $811.65 | $3,517 | $42,206 |
Compare PT Wages With Similar Roles
| Role | Median Hourly |
|---|---|
| Physical Therapist (Washington) | $50.73 |
| Physical Therapist Assistant (National Avg) | $31.26 |
| Occupational Therapist (National Avg) | $47.00 |
| Chiropractor (National Avg) | $36.85 |
| Exercise Physiologist (National Avg) | $26.75 |
Physical Therapists in Washington, DC earn a median of $105,513 per year (2026 est.), which is 0.21% higher than the national median of $105,288 and 14.30% below the District of Columbia state average of $123,119.
Physical Therapist Hourly Pay vs. Cost of Living
Working 24h/week at $50.73/hr = $63,308/year (purchasing power: $58,143).
Working 40h/week (full-time) = $105,514/year (purchasing power: $96,905).
CoL index: 108.884 (100 = national average).
2019 BLS Actual
$44.21/hr
2025 BLS Actual
$49.51/hr
2026 Current Est.
$50.73/hr
2019–2027 Growth
+17.6%
Hourly Rate Trajectory for Physical Therapists in Washington (2019–2027)
2019–2025: actual BLS OEWS data for this metro area. 2026+: CAGR 2.46% projection.
| Year | Hourly Rate | Status |
|---|---|---|
| 2019 | $44.21/hr | Actual |
| 2020 | $45.52/hr | Actual |
| 2021 | $47.91/hr | Actual |
| 2022 | $48.21/hr | Actual |
| 2023 | $49.55/hr | Actual |
| 2024 | $50.42/hr | Actual |
| 2025 | $49.51/hr | Actual |
| 2026(current) | $50.73/hr | Estimated |
| 2027 | $51.98/hr | Projected |
Based on 7 years of BLS OEWS metropolitan area data, the median hourly rate for physical therapists in Washington grew 12.0% from $44.21/hr (2019) to $49.51/hr (2025). At a 2.46% projected growth rate, hourly pay is expected to reach $51.98/hr by 2027. Part-time and per-diem physical therapists can use this multi-year trend to benchmark future contract negotiations.
Note: Historical values (2019–2025) are actual BLS OEWS figures for the Washington metropolitan area, sourced from annual Occupational Employment and Wage Statistics surveys. 2026–2026 figures are current estimates, and 2027 values are projections, calculated using a 2.46% CAGR derived from 7-year BLS historical data. Actual salaries may vary based on employer, experience, certifications, and local market conditions.
Working as an Hourly Physical Therapist in Washington
In evaluating the potential earnings for part-time physical therapists, those working three days a week at 24 hours can expect to bring home approximately $61,743 annually, which is significantly less than their full-time counterparts but still offers valuable income for those pursuing a balanced career. Per diem physical therapists in Washington typically command rates between $50 and $75 per hour, with travel assignments often yielding weekly payments of $1,800 to $2,800. This flexibility is appealing but may come with trade-offs like lack of benefits compared to salaried positions in hospital systems. Different employment settings impact pay variably; for instance, outpatient orthopedic clinics may offer lower hourly rates but provide bonuses based on productivity, while home health agencies might compensate better but require travel. Physical therapists should adopt strong negotiation strategies, especially in a city like Washington, where benefits versus higher hourly rates can markedly influence overall job satisfaction.
More salary data for Washington, DC:
Frequently Asked Questions
What is the hourly rate for physical therapists in Washington in 2026?
How much do part-time physical therapists make in Washington?
Are physical therapists in Washington paid hourly or salary?
How much does a full-time physical therapist make per year in Washington?
Do physical therapists earn more per hour working part-time in Washington?
Related Pages
Career Resources
Written by Alex Morgan, DPT
Career Analyst
Alex Morgan has over 10 years of experience in physical therapy. They specialize in orthopedic rehabilitation. Alex works in a private practice setting.
Methodology & Data Source
Hourly wage figures on this page are 2026 projections based on the Bureau of Labor Statistics Occupational Employment and Wage Statistics (OEWS) survey, May 2026 release. A 2.46% compound annual growth rate (CAGR), derived from 6-year national BLS wage trends, was applied to estimate current 2026 hourly rates for physical therapists in Washington. Part-time and full-time income estimates assume consistent weekly hours and do not account for overtime, benefits, or seasonal variation.
Data Sources & Methodology
Source: BLS, OEWS, 7-year dataset (–). Per-city data from annual BLS metropolitan area surveys.
2026 figures are projected from 2025 BLS data using a compound annual growth rate (CAGR) of 2.46%, derived from historical BLS wage trends for physical therapists (SOC 29-1123).
Compiled and verified by Alex Morgan, DPT, a licensed physical therapist with 10+ years of clinical experience. · View source data at BLS.gov