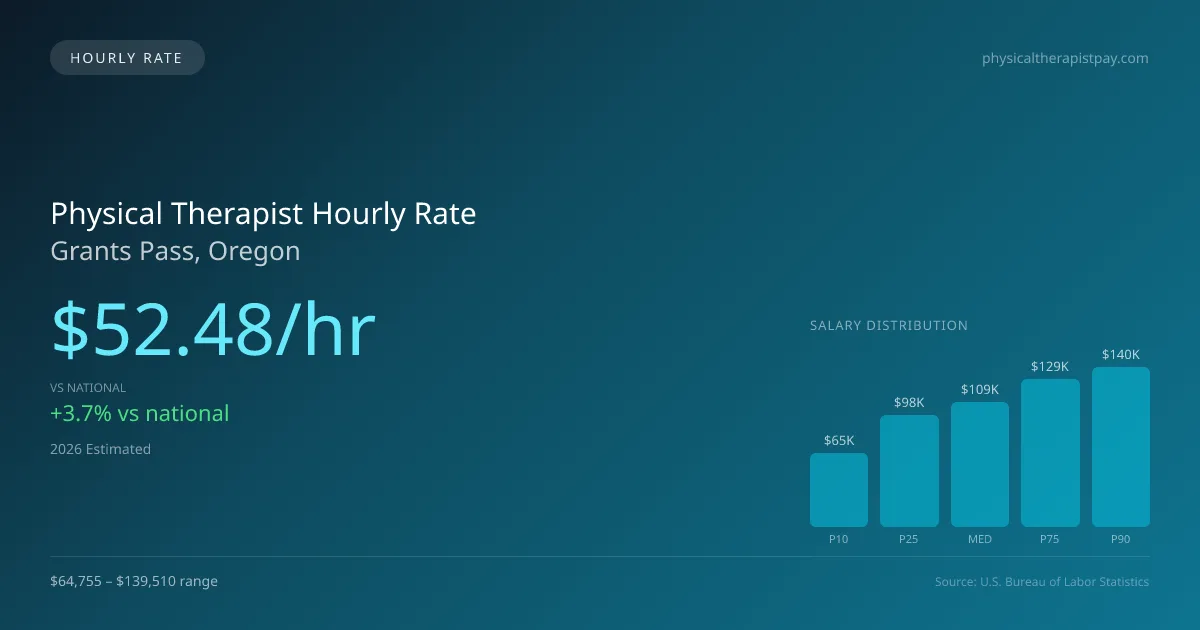
Physical Therapist Hourly Pay in Grants Pass, OR: $52.48 (2026)
Quick Answer:Hourly pay for a physical therapist working in Grants Pass, OR runs $52.48 at the median for 2026 — annualizing to $109,171 at a standard 2,080-hour year. Figures projected from BLS OEWS 2025 (SOC 29-1123). Weighted against Grants Pass's regional price level (BEA RPP 97.8, 2% below national), each hour of work buys what $53.68 nationally would. A 24-hour part-time schedule grosses $65,495 per year.
Official BLS data · View source
In Grants Pass, Oregon, physical therapists earn a median hourly pay of $52.48, which is notably higher than the national median of $50.62 per hour. This advantageous hourly rate presents attractive earning possibilities for both part-time and per-diem workers, who often find employment in various environments such as outpatient clinics, rehabilitation hospitals, skilled nursing facilities, home health agencies, and sports performance centers. With an hourly pay scale ranging from $31.14 for entry-level positions to $67.07 for experienced professionals, physical therapy offers significant opportunities for those entering the field in Grants Pass. These figures are based on 2025 BLS OEWS data, projected to 2026, thus providing a reliable snapshot of the expected earnings landscape for physical therapists in this locale.
Physical Therapist Hourly Wage Breakdown
| Percentile | Hourly Rate | Per 8hr Shift |
|---|---|---|
| Entry Level (P10) | $31.14 | $249.10 |
| Lower Range (P25) | $47.09 | $376.72 |
| Median (P50) | $52.48 | $419.84 |
| Upper Range (P75) | $62.21 | $497.71 |
| Top Earners (P90) | $67.07 | $536.56 |
Estimated Annual Income by Work Schedule in Grants Pass
Based on $52.48/hr median hourly rate · 2026 est.
At $52.48/hr, a physical therapist working full-time (40 hr/wk) in Grants Pass, OR can expect to earn approximately $109,158 per year (2026 est.). Part-time hygienists working 24 hours per week would earn around $62,976. With a cost-of-living index of 97.76 (below the national average), these earnings stretch further in Grants Pass.
Hourly Rate Calculator
Schedule Comparison in Grants Pass
| Schedule | Weekly | Monthly | Annual |
|---|---|---|---|
| Full-Time (40 hrs) | $2,099.20 | $9,097 | $109,158 |
| Part-Time (24 hrs) | $1,259.52 | $5,458 | $65,495 |
| Per Diem (16 hrs) | $839.68 | $3,639 | $43,663 |
Compare PT Wages With Similar Roles
| Role | Median Hourly |
|---|---|
| Physical Therapist (Grants Pass) | $52.48 |
| Physical Therapist Assistant (National Avg) | $31.26 |
| Occupational Therapist (National Avg) | $47.00 |
| Chiropractor (National Avg) | $36.85 |
| Exercise Physiologist (National Avg) | $26.75 |
Physical Therapists in Grants Pass, OR earn a median of $109,171 per year (2026 est.), which is 3.69% higher than the national median of $105,288 and 4.80% above the Oregon state average of $104,171.
Physical Therapist Hourly Pay vs. Cost of Living
Working 24h/week at $52.48/hr = $65,495/year (purchasing power: $66,996).
Working 40h/week (full-time) = $109,158/year (purchasing power: $111,660).
CoL index: 97.76 (100 = national average). Your dollars stretch further here.
2019 BLS Actual
$44.58/hr
2025 BLS Actual
$51.22/hr
2026 Current Est.
$52.48/hr
2019–2027 Growth
+20.6%
Hourly Rate Trajectory for Physical Therapists in Grants Pass (2019–2027)
2019–2025: actual BLS OEWS data for this metro area. 2026+: CAGR 2.46% projection.
| Year | Hourly Rate | Status |
|---|---|---|
| 2019 | $44.58/hr | Actual |
| 2020 | $45.54/hr | Actual |
| 2021 | $38.40/hr | Actual |
| 2022 | $46.78/hr | Actual |
| 2023 | $47.87/hr | Actual |
| 2024 | $49.80/hr | Actual |
| 2025 | $51.22/hr | Actual |
| 2026(current) | $52.48/hr | Estimated |
| 2027 | $53.77/hr | Projected |
Based on 7 years of BLS OEWS metropolitan area data, the median hourly rate for physical therapists in Grants Pass grew 14.9% from $44.58/hr (2019) to $51.22/hr (2025). At a 2.46% projected growth rate, hourly pay is expected to reach $53.77/hr by 2027. Part-time and per-diem physical therapists can use this multi-year trend to benchmark future contract negotiations.
Note: Historical values (2019–2025) are actual BLS OEWS figures for the Grants Pass metropolitan area, sourced from annual Occupational Employment and Wage Statistics surveys. 2026–2026 figures are current estimates, and 2027 values are projections, calculated using a 2.46% CAGR derived from 7-year BLS historical data. Actual salaries may vary based on employer, experience, certifications, and local market conditions.
Working as an Hourly Physical Therapist in Grants Pass
Exploring the financial realities for part-time physical therapists in Grants Pass, working three days a week for 24 hours totals an annual income of approximately $40,000, significantly less than a full-time therapist's potential earnings. For those considering per-diem positions, the earning capacity can be lucrative, with common billing rates between $50-$75 per hour. Travel physical therapist contracts can also yield substantial income, averaging $1,800-$2,800 per week, including additional stipends. It's essential to recognize that different employer types affect hourly wages, with outpatient orthopedic clinics typically offering lower pay than hospital settings, yet providing productivity bonuses. Some therapists might opt for positions with lower hourly rates in exchange for health insurance benefits. Therefore, when negotiating salaries, potential employees should weigh these benefits against their personal financial needs and preferences, ensuring they maximize their income in the competitive Grants Pass market.
More salary data for Grants Pass, OR:
Frequently Asked Questions
What is the hourly rate for physical therapists in Grants Pass in 2026?
How much do part-time physical therapists make in Grants Pass?
Are physical therapists in Grants Pass paid hourly or salary?
How much does a full-time physical therapist make per year in Grants Pass?
Do physical therapists earn more per hour working part-time in Grants Pass?
Related Pages
Compare Salaries
Career Resources
Nearby Cities in Oregon
Written by Alex Morgan, DPT
Career Analyst
Alex Morgan has over 10 years of experience in physical therapy. They specialize in orthopedic rehabilitation. Alex works in a private practice setting.
Methodology & Data Source
Hourly wage figures on this page are 2026 projections based on the Bureau of Labor Statistics Occupational Employment and Wage Statistics (OEWS) survey, May 2026 release. A 2.46% compound annual growth rate (CAGR), derived from 6-year national BLS wage trends, was applied to estimate current 2026 hourly rates for physical therapists in Grants Pass. Part-time and full-time income estimates assume consistent weekly hours and do not account for overtime, benefits, or seasonal variation.
Data Sources & Methodology
Source: BLS, OEWS, 6-year dataset (–). Per-city data from annual BLS metropolitan area surveys.
2026 figures are projected from 2025 BLS data using a compound annual growth rate (CAGR) of 2.46%, derived from historical BLS wage trends for physical therapists (SOC 29-1123).
Compiled and verified by Alex Morgan, DPT, a licensed physical therapist with 10+ years of clinical experience. · View source data at BLS.gov