Physical Therapist Hourly Pay in Providence, RI: $49.41 (2026)
Quick Answer:Hourly pay for a physical therapist working in Providence, RI runs $49.41 at the median for 2026 — annualizing to $102,757 at a standard 2,080-hour year. Figures projected from BLS OEWS 2025 (SOC 29-1123). Weighted against Providence's regional price level (BEA RPP 101.8, 2% above national), each hour of work buys what $48.55 nationally would. A 24-hour part-time schedule grosses $61,659 per year.
Official BLS data · View source
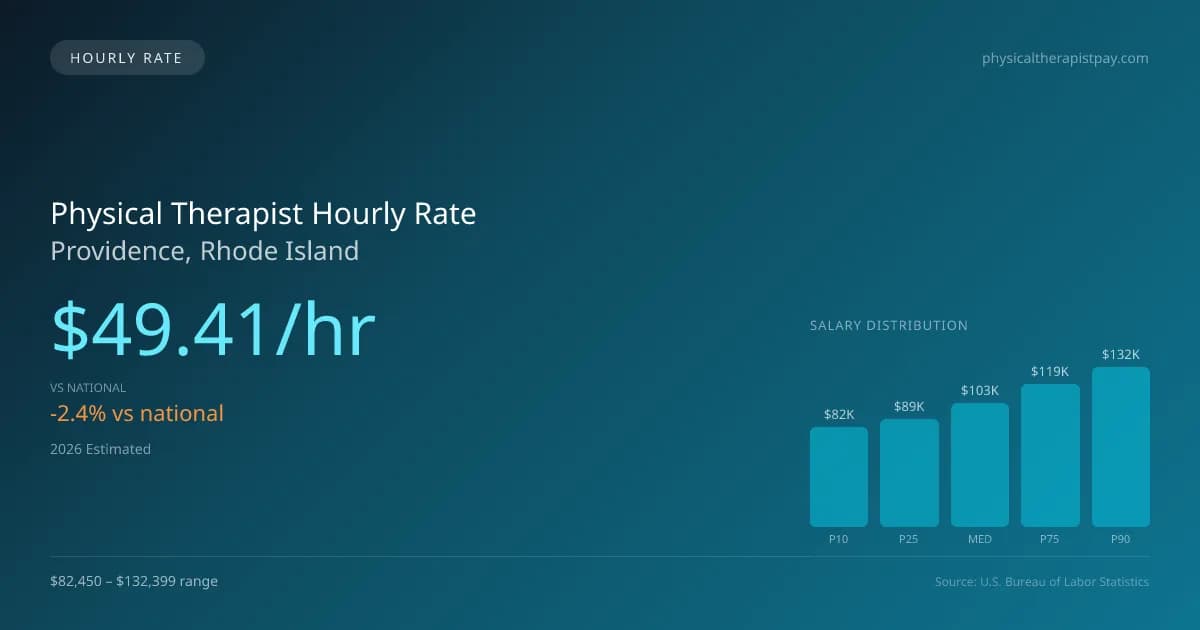
In Providence, Rhode Island, the projected median hourly pay for physical therapists is $49.41, slightly below the national median of $50.62. This rate can provide a stable income for both full-time practitioners and those working part-time or per-diem shifts. For example, part-time physical therapists working three days a week can earn a respectable income while enjoying flexibility in their schedules, which is particularly beneficial in various clinical settings like outpatient clinics, skilled nursing facilities, and home health visits. The hourly pay range in Providence spans from $39.64 for entry-level positions to $63.66 for top earners, allowing for varied earning potential based on experience and expertise in areas such as sports rehabilitation or pediatric therapy. The figures presented here come from official BLS data, based on 2025 BLS OEWS data projected to 2026.
Physical Therapist Hourly Wage Breakdown
| Percentile | Hourly Rate | Per 8hr Shift |
|---|---|---|
| Entry Level (P10) | $39.64 | $317.13 |
| Lower Range (P25) | $42.89 | $343.12 |
| Median (P50) | $49.41 | $395.25 |
| Upper Range (P75) | $57.03 | $456.23 |
| Top Earners (P90) | $63.66 | $509.27 |
Estimated Annual Income by Work Schedule in Providence
Based on $49.41/hr median hourly rate · 2026 est.
At $49.41/hr, a physical therapist working full-time (40 hr/wk) in Providence, RI can expect to earn approximately $102,765 per year (2026 est.). Part-time hygienists working 24 hours per week would earn around $59,287. With a cost-of-living index of 101.77 (above the national average), these earnings may be offset by higher expenses in Providence.
Hourly Rate Calculator
Schedule Comparison in Providence
| Schedule | Weekly | Monthly | Annual |
|---|---|---|---|
| Full-Time (40 hrs) | $1,976.25 | $8,564 | $102,765 |
| Part-Time (24 hrs) | $1,185.75 | $5,138 | $61,659 |
| Per Diem (16 hrs) | $790.50 | $3,425 | $41,106 |
Compare PT Wages With Similar Roles
| Role | Median Hourly |
|---|---|
| Physical Therapist (Providence) | $49.41 |
| Physical Therapist Assistant (National Avg) | $31.26 |
| Occupational Therapist (National Avg) | $47.00 |
| Chiropractor (National Avg) | $36.85 |
| Exercise Physiologist (National Avg) | $26.75 |
Physical Therapists in Providence, RI earn a median of $102,757 per year (2026 est.), which is 2.40% lower than the national median of $105,288 and 2.90% below the Rhode Island state average of $105,826.
Physical Therapist Hourly Pay vs. Cost of Living
Working 24h/week at $49.41/hr = $61,659/year (purchasing power: $60,585).
Working 40h/week (full-time) = $102,765/year (purchasing power: $100,975).
CoL index: 101.773 (100 = national average).
2019 BLS Actual
$40.95/hr
2025 BLS Actual
$48.22/hr
2026 Current Est.
$49.41/hr
2019–2027 Growth
+23.6%
Hourly Rate Trajectory for Physical Therapists in Providence (2019–2027)
2019–2025: actual BLS OEWS data for this metro area. 2026+: CAGR 2.46% projection.
| Year | Hourly Rate | Status |
|---|---|---|
| 2019 | $40.95/hr | Actual |
| 2020 | $42.16/hr | Actual |
| 2021 | $46.13/hr | Actual |
| 2022 | $46.20/hr | Actual |
| 2023 | $46.22/hr | Actual |
| 2024 | $49.26/hr | Actual |
| 2025 | $48.22/hr | Actual |
| 2026(current) | $49.41/hr | Estimated |
| 2027 | $50.62/hr | Projected |
Based on 7 years of BLS OEWS metropolitan area data, the median hourly rate for physical therapists in Providence grew 17.8% from $40.95/hr (2019) to $48.22/hr (2025). At a 2.46% projected growth rate, hourly pay is expected to reach $50.62/hr by 2027. Part-time and per-diem physical therapists can use this multi-year trend to benchmark future contract negotiations.
Note: Historical values (2019–2025) are actual BLS OEWS figures for the Providence metropolitan area, sourced from annual Occupational Employment and Wage Statistics surveys. 2026–2026 figures are current estimates, and 2027 values are projections, calculated using a 2.46% CAGR derived from 7-year BLS historical data. Actual salaries may vary based on employer, experience, certifications, and local market conditions.
Working as an Hourly Physical Therapist in Providence
When considering the financial realities for part-time workers, a physical therapist in Providence who works only 24 hours per week would take home significantly less annually compared to their full-time counterparts. Per diem physical therapists typically charge between $50 and $75 per hour, while travel contracts may yield weekly compensations ranging from $1,800 to $2,800, inclusive of stipends. Additionally, cash-pay arrangements for specialized services can reach as high as $150 to $250 per hour, especially within high-cost areas like Providence. The hourly rates can also vary greatly depending on the type of employer, with outpatient clinics often offering lower pay compared to hospital systems that provide better benefits. Negotiating effectively can be crucial, especially for those prioritizing coverage over higher pay and navigating different employer types. Understanding the dynamics of compensation in connection with productivity demands and reimbursement trends is essential for physical therapists looking to maximize their income in Rhode Island.
More salary data for Providence, RI:
Frequently Asked Questions
What is the hourly rate for physical therapists in Providence in 2026?
How much do part-time physical therapists make in Providence?
Are physical therapists in Providence paid hourly or salary?
How much does a full-time physical therapist make per year in Providence?
Do physical therapists earn more per hour working part-time in Providence?
Related Pages
Compare Salaries
Career Resources
Nearby Cities in Rhode Island
Written by Alex Morgan, DPT
Career Analyst
Alex Morgan has over 10 years of experience in physical therapy. They specialize in orthopedic rehabilitation. Alex works in a private practice setting.
Methodology & Data Source
Hourly wage figures on this page are 2026 projections based on the Bureau of Labor Statistics Occupational Employment and Wage Statistics (OEWS) survey, May 2026 release. A 2.46% compound annual growth rate (CAGR), derived from 6-year national BLS wage trends, was applied to estimate current 2026 hourly rates for physical therapists in Providence. Part-time and full-time income estimates assume consistent weekly hours and do not account for overtime, benefits, or seasonal variation.
Data Sources & Methodology
Source: BLS, OEWS, 7-year dataset (–). Per-city data from annual BLS metropolitan area surveys.
2026 figures are projected from 2025 BLS data using a compound annual growth rate (CAGR) of 2.46%, derived from historical BLS wage trends for physical therapists (SOC 29-1123).
Compiled and verified by Alex Morgan, DPT, a licensed physical therapist with 10+ years of clinical experience. · View source data at BLS.gov