Physical Therapist Salary in El Cajon, CA: $127,905 (2026)
Quick Answer:A full-time physical therapist in El Cajon, CA earns a median $127,905/year (≈ $61.50/hour) in nominal terms for 2026 — projected from BLS OEWS 2025 (SOC 29-1123). Once you factor in El Cajon's price level (13% above national, BEA RPP 113.1), that paycheck buys what $113,090 would nationally. Nominal pay sits 0.5% below the California state average.
Based on BLS state-level estimates · View source
In 2026, physical therapists in El Cajon, California can expect to earn a median salary of $127,905, surpassing the national median of $105,288 by 21.48%. The local salary range highlights significant disparities, with entry-level positions starting around $92,408 (P10) and top earners reaching approximately $171,124 (P90). Estimates derived from 2025 BLS data and adjusted for regional price parities give a clear picture of local compensation expectations. As healthcare continues to evolve, particularly with rising visit-per-day pressures in outpatient settings, therapists need to strategically position themselves to maximize their productivity and their pay in a competitive job market.
About the El Cajon Market
Salary estimated from California average ($109,000) adjusted for local cost of living.
Salary Breakdown
| Percentile | Annual | Hourly |
|---|---|---|
| Entry Level (P10) | $92,408 | $44.43 |
| Lower Range (P25) | $104,320 | $50.15 |
| Median (P50)(typical) | $127,905 | $61.50 |
| Upper Range (P75) | $152,612 | $73.37 |
| Top Earners (P90) | $171,124 | $82.28 |
Median Salary Position
21.48% above the national average
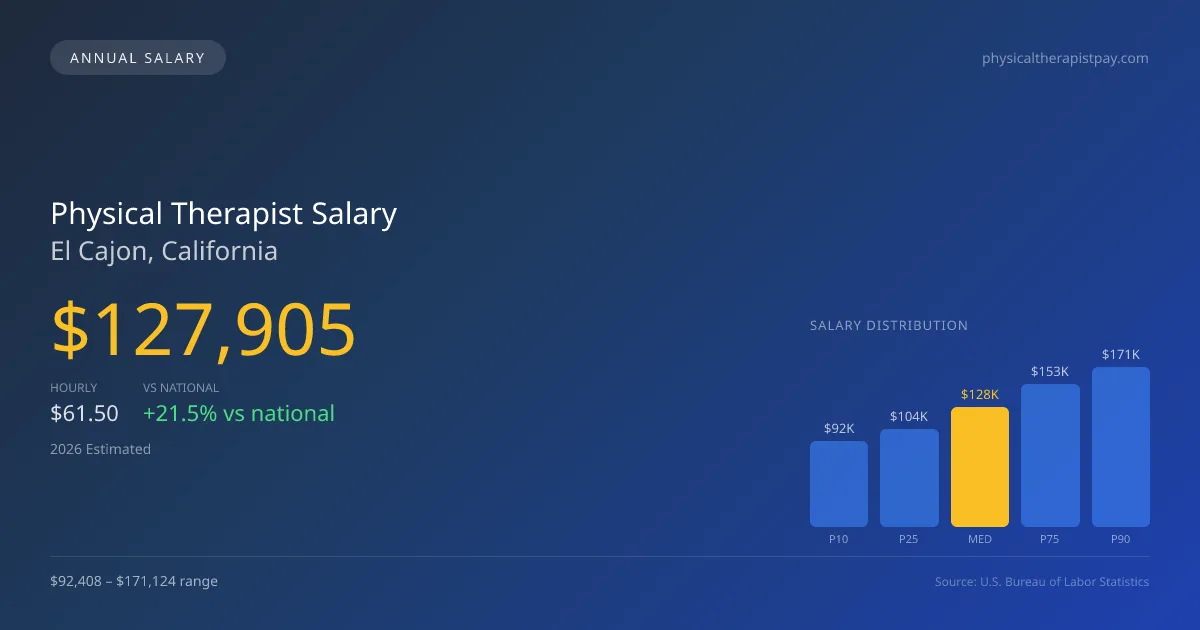
2026 Salary Percentile Distribution in El Cajon
In El Cajon, CA, the physical therapist salary spread from the 10th to 90th percentile is $78,716 (2026 est.). At $127,905, the local median is 21.48% above the national median of $105,288.
Salary Calculator
At 40 hours/week in El Cajon: You'd be in the lower-middle range
How El Cajon Physical Therapist Pay Compares
El Cajon median: $127,905/year (2026)
| Compared To | Median Salary | El Cajon Pays |
|---|---|---|
| California Average | $128,548 | -0.50% less |
| National Average | $105,288 | +21.48% more |
Physical Therapists in El Cajon, CA earn a median of $127,905 per year (2026 est.), which is 21.48% higher than the national median of $105,288 and 0.50% below the California state average of $128,548.
Cost-of-Living Adjusted Salary
El Cajon has a cost of living 13.10% above the national average.
Adjusted salary = nominal × (100 / CoL index). CoL index: 100 = national average.
El Cajon, CA has a cost-of-living index of 113.1 (above the national average of 100). While the nominal salary of $127,905 is competitive, the higher cost of living reduces purchasing power to an effective $113,090 — a 11.58% reduction.
Compare Purchasing Power
Select a city to see how your salary compares after cost of living
Select a city above to compare purchasing power
2019 BLS Actual
$108,653
2025 BLS Actual
$124,834
2026 Current Est.
$127,905
2019–2027 Growth
+20.6%
Salary Trajectory for Physical Therapists in El Cajon (2019–2027)
2019–2025: actual BLS OEWS data for this metro area. 2026+: CAGR 2.46% projection.
| Year | Annual Salary | Status |
|---|---|---|
| 2019 | $108,653 | Actual |
| 2020 | $110,560 | Actual |
| 2021 | $116,160 | Actual |
| 2022 | $118,711 | Actual |
| 2023 | $121,129 | Actual |
| 2024 | $122,634 | Actual |
| 2025 | $124,834 | Actual |
| 2026(current) | $127,905 | Estimated |
| 2027 | $131,051 | Projected |
Based on 7 years of BLS OEWS data for the El Cajon metropolitan area, the median physical therapist salary grew 14.9% from $108,653 (2019) to $124,834 (2025). At a 2.46% compound annual growth rate, salaries are projected to reach $131,051 by 2027 — a total increase of $22,398 (20.61%) from 2019.
Note: Historical values (2019–2025) are actual BLS OEWS figures for the El Cajon metropolitan area, sourced from annual Occupational Employment and Wage Statistics surveys. 2026–2026 figures are current estimates, and 2027 values are projections, calculated using a 2.46% CAGR derived from 7-year BLS historical data. Actual salaries may vary based on employer, experience, certifications, and local market conditions.
Salary by Experience Level
| Experience | Estimated Salary Range |
|---|---|
| 0-2 years (New Graduate) | $92,408 – $104,320 |
| 3-5 years (Mid Career) | $104,320 – $127,905 |
| 5+ years (Experienced) | $127,905 – $152,612 |
| 10+ years (Top Earner) | $152,612 – $171,124 |
PT salary ranges estimated from BLS percentile data. Individual physical therapist compensation varies by employer, certifications, and specialization.
Physical Therapist Job Market in El Cajon
With only 18 physical therapists employed within the El Cajon area, the job market remains relatively small, potentially limiting local opportunities. The cost of living index in El Cajon stands at 113.1, indicating that while salaries are higher than the national average, purchasing power may be affected by living expenses. Employers that tend to pay the most include outpatient orthopedic clinics and hospital rehabilitation facilities, where productivity expectations, such as visits per day and specific board certification stipends (like OCS or SCS), heavily influence compensation. The spectrum of salaries in this region is largely driven by the balance between cash-pay versus insurance models and clinic ownership stakes. By seeking opportunities in higher-paying environments and pursuing specialization credentials, physical therapists can enhance their earning potential in El Cajon, CA.
More salary data for El Cajon, CA:
Frequently Asked Questions
How much do physical therapists make in El Cajon, CA in 2026?
Is El Cajon, CA a good place to work as a physical therapist?
Can physical therapists make $100K in El Cajon?
What is the cost-of-living adjusted physical therapist salary in El Cajon?
How much does a physical therapist make per hour in El Cajon?
Related Pages
Compare Salaries
Career Resources
Nearby Cities in California
Written by Alex Morgan, DPT
Career Analyst
Alex Morgan has over 10 years of experience in physical therapy. They specialize in orthopedic rehabilitation. Alex works in a private practice setting.
Methodology & Data Source
Salary figures on this page are 2026 projections based on the Bureau of Labor Statistics Occupational Employment and Wage Statistics (OEWS) survey, May 2026 release. The BLS reported a median annual salary of $124,834 for physical therapistsin the El Cajon metropolitan area. A 2.46% compound annual growth rate (CAGR), calculated from 6-year national BLS wage trends, was applied to project current 2026 compensation. Percentile ranges (P10–P90) represent the full salary distribution across experience levels and practice settings in this market.
Data Sources & Methodology
Salary data for El Cajon is estimated from official BLS state-level occupational wage data (2025), adjusted for regional cost-of-living differences using BEA RPP (Regional Price Parities).
2026 figures are projected from 2025 BLS data using a compound annual growth rate (CAGR) of 2.46%, derived from historical BLS wage trends for physical therapists (SOC 29-1123).
Compiled and verified by Alex Morgan, DPT, a licensed physical therapist with 10+ years of clinical experience. · View source data at BLS.gov