Physical Therapist Salary in Palo Alto, CA: $125,362 (2026)
Quick Answer:A full-time physical therapist in Palo Alto, CA earns a median $125,362/year (≈ $60.27/hour) in nominal terms for 2026 — projected from BLS OEWS 2025 (SOC 29-1123). Once you factor in Palo Alto's price level (13% above national, BEA RPP 113.1), that paycheck buys what $110,842 would nationally. Nominal pay sits 2.5% below the California state average.
Based on BLS state-level estimates · View source
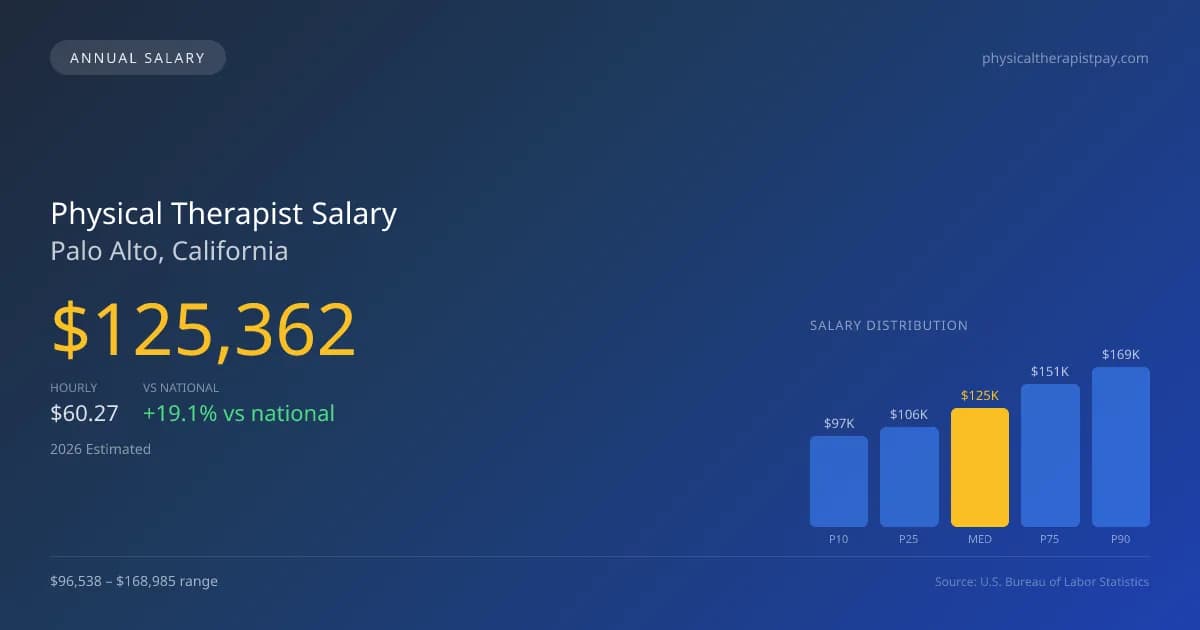
In 2026, the projected compensation for physical therapists practicing in Palo Alto, California, reaches a median annual salary of $125,362. This figure notably exceeds the national median of $105,288, indicating a strong local market for physical therapists. The salary range spans from $96,538 at the 10th percentile to $168,985 at the 90th percentile, reflecting the diverse opportunities available in this tech-centered region. Estimates derived from 2025 BLS data adjusted for local economic conditions suggest that those employed in outpatient clinics, particularly private practices and large chains, may experience different compensation structures influenced by factors like productivity and visit volume compared to hospital-based rehabilitation services.
About the Palo Alto Market
Salary estimated from California average ($109,000) adjusted for local cost of living.
Salary Breakdown
| Percentile | Annual | Hourly |
|---|---|---|
| Entry Level (P10) | $96,538 | $46.41 |
| Lower Range (P25) | $105,995 | $50.96 |
| Median (P50)(typical) | $125,362 | $60.27 |
| Upper Range (P75) | $150,835 | $72.52 |
| Top Earners (P90) | $168,985 | $81.24 |
Median Salary Position
19.07% above the national average
2026 Salary Percentile Distribution in Palo Alto
In Palo Alto, CA, the physical therapist salary spread from the 10th to 90th percentile is $72,447 (2026 est.). At $125,362, the local median is 19.07% above the national median of $105,288.
Salary Calculator
At 40 hours/week in Palo Alto: You'd be in the lower-middle range
How Palo Alto Physical Therapist Pay Compares
Palo Alto median: $125,362/year (2026)
| Compared To | Median Salary | Palo Alto Pays |
|---|---|---|
| California Average | $128,576 | -2.50% less |
| National Average | $105,288 | +19.07% more |
Physical Therapists in Palo Alto, CA earn a median of $125,362 per year (2026 est.), which is 19.07% higher than the national median of $105,288 and 2.50% below the California state average of $128,576.
Cost-of-Living Adjusted Salary
Palo Alto has a cost of living 13.10% above the national average.
Adjusted salary = nominal × (100 / CoL index). CoL index: 100 = national average.
Palo Alto, CA has a cost-of-living index of 113.1 (above the national average of 100). While the nominal salary of $125,362 is competitive, the higher cost of living reduces purchasing power to an effective $110,842 — a 11.58% reduction.
Compare Purchasing Power
Select a city to see how your salary compares after cost of living
Select a city above to compare purchasing power
2019 BLS Actual
$106,492
2025 BLS Actual
$122,352
2026 Current Est.
$125,362
2019–2027 Growth
+20.6%
Salary Trajectory for Physical Therapists in Palo Alto (2019–2027)
2019–2025: actual BLS OEWS data for this metro area. 2026+: CAGR 2.46% projection.
| Year | Annual Salary | Status |
|---|---|---|
| 2019 | $106,492 | Actual |
| 2020 | $108,362 | Actual |
| 2021 | $113,851 | Actual |
| 2022 | $116,351 | Actual |
| 2023 | $118,720 | Actual |
| 2024 | $120,196 | Actual |
| 2025 | $122,352 | Actual |
| 2026(current) | $125,362 | Estimated |
| 2027 | $128,446 | Projected |
Based on 7 years of BLS OEWS data for the Palo Alto metropolitan area, the median physical therapist salary grew 14.9% from $106,492 (2019) to $122,352 (2025). At a 2.46% compound annual growth rate, salaries are projected to reach $128,446 by 2027 — a total increase of $21,954 (20.62%) from 2019.
Note: Historical values (2019–2025) are actual BLS OEWS figures for the Palo Alto metropolitan area, sourced from annual Occupational Employment and Wage Statistics surveys. 2026–2026 figures are current estimates, and 2027 values are projections, calculated using a 2.46% CAGR derived from 7-year BLS historical data. Actual salaries may vary based on employer, experience, certifications, and local market conditions.
Salary by Experience Level
| Experience | Estimated Salary Range |
|---|---|
| 0-2 years (New Graduate) | $96,538 – $105,995 |
| 3-5 years (Mid Career) | $105,995 – $125,362 |
| 5+ years (Experienced) | $125,362 – $150,835 |
| 10+ years (Top Earner) | $150,835 – $168,985 |
PT salary ranges estimated from BLS percentile data. Individual physical therapist compensation varies by employer, certifications, and specialization.
Physical Therapist Job Market in Palo Alto
With a workforce of only 15 physical therapists in the area, Palo Alto's job market remains competitive, which can impact earnings potential. The cost of living index at 113.1 indicates that while salaries are favorable, local purchasing power is also a vital consideration for prospective employees. Among the various employers, outpatient orthopedic chains like ATI and Athletico might offer slightly lower base salaries but can provide productivity bonuses that significantly enhance overall earnings. Board certifications such as OCS or SCS may also increase pay through stipends. To maximize their income, physical therapists in Palo Alto should focus on establishing strong patient relationships and consider working in settings that incentivize performance. Aligning with growing trends in cash-pay models may also present beneficial opportunities within the evolving landscape of physical therapist pay in Palo Alto, CA.
More salary data for Palo Alto, CA:
Frequently Asked Questions
How much do physical therapists make in Palo Alto, CA in 2026?
Is Palo Alto, CA a good place to work as a physical therapist?
Can physical therapists make $100K in Palo Alto?
What is the cost-of-living adjusted physical therapist salary in Palo Alto?
How much does a physical therapist make per hour in Palo Alto?
Related Pages
Compare Salaries
Career Resources
Nearby Cities in California
Written by Alex Morgan, DPT
Career Analyst
Alex Morgan has over 10 years of experience in physical therapy. They specialize in orthopedic rehabilitation. Alex works in a private practice setting.
Methodology & Data Source
Salary figures on this page are 2026 projections based on the Bureau of Labor Statistics Occupational Employment and Wage Statistics (OEWS) survey, May 2026 release. The BLS reported a median annual salary of $122,352 for physical therapistsin the Palo Alto metropolitan area. A 2.46% compound annual growth rate (CAGR), calculated from 6-year national BLS wage trends, was applied to project current 2026 compensation. Percentile ranges (P10–P90) represent the full salary distribution across experience levels and practice settings in this market.
Data Sources & Methodology
Salary data for Palo Alto is estimated from official BLS state-level occupational wage data (2025), adjusted for regional cost-of-living differences using BEA RPP (Regional Price Parities).
2026 figures are projected from 2025 BLS data using a compound annual growth rate (CAGR) of 2.46%, derived from historical BLS wage trends for physical therapists (SOC 29-1123).
Compiled and verified by Alex Morgan, DPT, a licensed physical therapist with 10+ years of clinical experience. · View source data at BLS.gov