Physical Therapist Salary in Pittsburg, CA: $129,282 (2026)
Quick Answer:A full-time physical therapist in Pittsburg, CA earns a median $129,282/year (≈ $62.15/hour) in nominal terms for 2026 — projected from BLS OEWS 2025 (SOC 29-1123). Once you factor in Pittsburg's price level (13% above national, BEA RPP 113.1), that paycheck buys what $114,308 would nationally. Nominal pay sits 0.5% above the California state average.
Based on BLS state-level estimates · View source
In 2026, physical therapists in Pittsburg, CA, can expect a median annual salary of $129,282, marking a significant 22.79% increase over the national median of $105,288. While salaries in the region range from $95,055 at the 10th percentile to $169,306 at the 90th percentile, these figures, derived from 2025 BLS data, illustrate the competitive compensation landscape for this profession. Cost-of-living adjustments in Pittsburgh, with a cost index of 113.1, affect monetary value perceived locally, emphasizing the high demand and productivity expectations that inform pay rates. This context suggests that therapists who are adept at maximizing patient outcomes within their daily productivity metrics will navigate a potentially lucrative market with enhanced earning opportunities.
About the Pittsburg Market
Salary estimated from California average ($109,000) adjusted for local cost of living.
Salary Breakdown
| Percentile | Annual | Hourly |
|---|---|---|
| Entry Level (P10) | $95,055 | $45.70 |
| Lower Range (P25) | $106,331 | $51.12 |
| Median (P50)(typical) | $129,282 | $62.15 |
| Upper Range (P75) | $152,573 | $73.35 |
| Top Earners (P90) | $169,306 | $81.39 |
Median Salary Position
22.79% above the national average
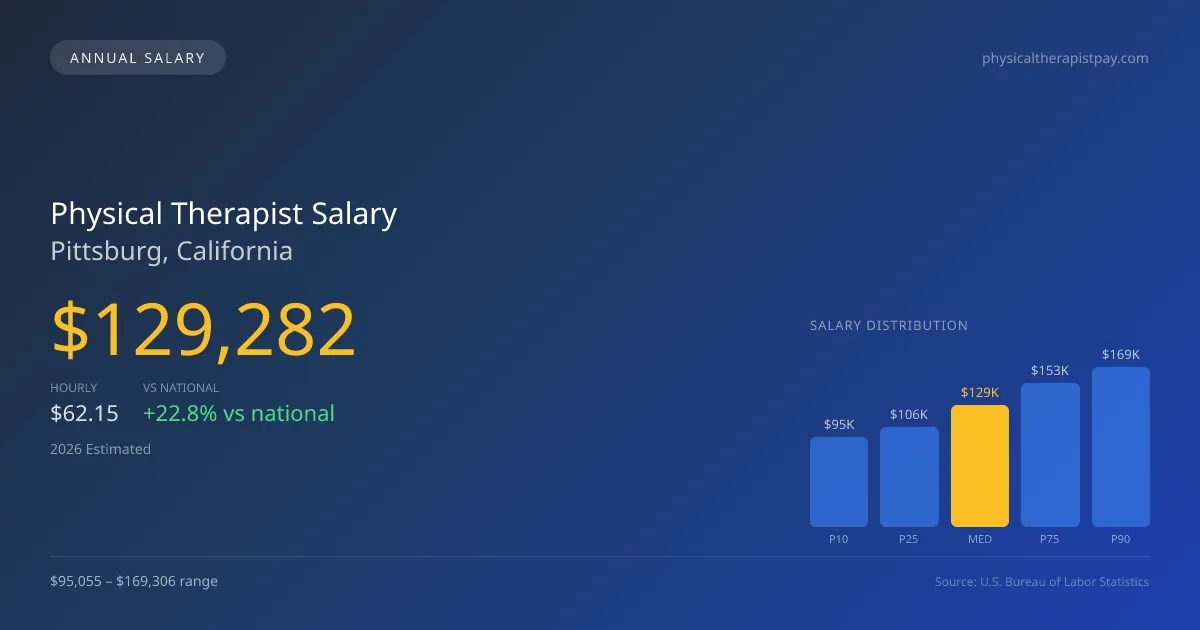
2026 Salary Percentile Distribution in Pittsburg
In Pittsburg, CA, the physical therapist salary spread from the 10th to 90th percentile is $74,251 (2026 est.). At $129,282, the local median is 22.79% above the national median of $105,288.
Salary Calculator
At 40 hours/week in Pittsburg: You'd be in the lower-middle range
How Pittsburg Physical Therapist Pay Compares
Pittsburg median: $129,282/year (2026)
| Compared To | Median Salary | Pittsburg Pays |
|---|---|---|
| California Average | $128,639 | +0.50% more |
| National Average | $105,288 | +22.79% more |
Physical Therapists in Pittsburg, CA earn a median of $129,282 per year (2026 est.), which is 22.79% higher than the national median of $105,288 and 0.50% above the California state average of $128,639.
Cost-of-Living Adjusted Salary
Pittsburg has a cost of living 13.10% above the national average.
Adjusted salary = nominal × (100 / CoL index). CoL index: 100 = national average.
Pittsburg, CA has a cost-of-living index of 113.1 (above the national average of 100). While the nominal salary of $129,282 is competitive, the higher cost of living reduces purchasing power to an effective $114,308 — a 11.58% reduction.
Compare Purchasing Power
Select a city to see how your salary compares after cost of living
Select a city above to compare purchasing power
2019 BLS Actual
$109,823
2025 BLS Actual
$126,178
2026 Current Est.
$129,282
2019–2027 Growth
+20.6%
Salary Trajectory for Physical Therapists in Pittsburg (2019–2027)
2019–2025: actual BLS OEWS data for this metro area. 2026+: CAGR 2.46% projection.
| Year | Annual Salary | Status |
|---|---|---|
| 2019 | $109,823 | Actual |
| 2020 | $111,750 | Actual |
| 2021 | $117,411 | Actual |
| 2022 | $119,989 | Actual |
| 2023 | $122,433 | Actual |
| 2024 | $123,955 | Actual |
| 2025 | $126,178 | Actual |
| 2026(current) | $129,282 | Estimated |
| 2027 | $132,462 | Projected |
Based on 7 years of BLS OEWS data for the Pittsburg metropolitan area, the median physical therapist salary grew 14.9% from $109,823 (2019) to $126,178 (2025). At a 2.46% compound annual growth rate, salaries are projected to reach $132,462 by 2027 — a total increase of $22,639 (20.61%) from 2019.
Note: Historical values (2019–2025) are actual BLS OEWS figures for the Pittsburg metropolitan area, sourced from annual Occupational Employment and Wage Statistics surveys. 2026–2026 figures are current estimates, and 2027 values are projections, calculated using a 2.46% CAGR derived from 7-year BLS historical data. Actual salaries may vary based on employer, experience, certifications, and local market conditions.
Salary by Experience Level
| Experience | Estimated Salary Range |
|---|---|
| 0-2 years (New Graduate) | $95,055 – $106,331 |
| 3-5 years (Mid Career) | $106,331 – $129,282 |
| 5+ years (Experienced) | $129,282 – $152,573 |
| 10+ years (Top Earner) | $152,573 – $169,306 |
PT salary ranges estimated from BLS percentile data. Individual physical therapist compensation varies by employer, certifications, and specialization.
Physical Therapist Job Market in Pittsburg
Analyzing the local job market reveals that there are currently 19 physical therapists employed in Pittsburg, a smaller pool that offers unique dynamics in salary negotiation and job competition. Given the relatively high cost of living, successful practitioners often seek positions in more lucrative settings, such as outpatient orthopedic chains like ATI or skilled nursing facilities, which typically offer varied compensation packages that may include performance bonuses linked to productivity levels. To enhance their market position, physical therapists should consider pursuing board certifications such as OCS or SCS, as these can add value to their skill set and make them more attractive to potential employers. Additionally, embracing trending payment models like cash-pay practices can further increase earning potential, especially in an environment shaped by stringent insurance reimbursement conditions. By being strategic about their career paths and continuing education, therapists can effectively navigate the salary landscape in Pittsburg, CA.
More salary data for Pittsburg, CA:
Frequently Asked Questions
How much do physical therapists make in Pittsburg, CA in 2026?
Is Pittsburg, CA a good place to work as a physical therapist?
Can physical therapists make $100K in Pittsburg?
What is the cost-of-living adjusted physical therapist salary in Pittsburg?
How much does a physical therapist make per hour in Pittsburg?
Related Pages
Compare Salaries
Career Resources
Nearby Cities in California
Written by Alex Morgan, DPT
Career Analyst
Alex Morgan has over 10 years of experience in physical therapy. They specialize in orthopedic rehabilitation. Alex works in a private practice setting.
Methodology & Data Source
Salary figures on this page are 2026 projections based on the Bureau of Labor Statistics Occupational Employment and Wage Statistics (OEWS) survey, May 2026 release. The BLS reported a median annual salary of $126,178 for physical therapistsin the Pittsburg metropolitan area. A 2.46% compound annual growth rate (CAGR), calculated from 6-year national BLS wage trends, was applied to project current 2026 compensation. Percentile ranges (P10–P90) represent the full salary distribution across experience levels and practice settings in this market.
Data Sources & Methodology
Salary data for Pittsburg is estimated from official BLS state-level occupational wage data (2025), adjusted for regional cost-of-living differences using BEA RPP (Regional Price Parities).
2026 figures are projected from 2025 BLS data using a compound annual growth rate (CAGR) of 2.46%, derived from historical BLS wage trends for physical therapists (SOC 29-1123).
Compiled and verified by Alex Morgan, DPT, a licensed physical therapist with 10+ years of clinical experience. · View source data at BLS.gov