Physical Therapist Salary in Redding, CA: $110,636 (2026)
Quick Answer:A full-time physical therapist in Redding, CA earns a median $110,636/year (≈ $53.19/hour) in nominal terms for 2026 — projected from BLS OEWS 2025 (SOC 29-1123). Once you factor in Redding's price level (1% above national, BEA RPP 100.7), that paycheck buys what $109,884 would nationally. Nominal pay sits 14.0% below the California state average.
Official BLS data · View source
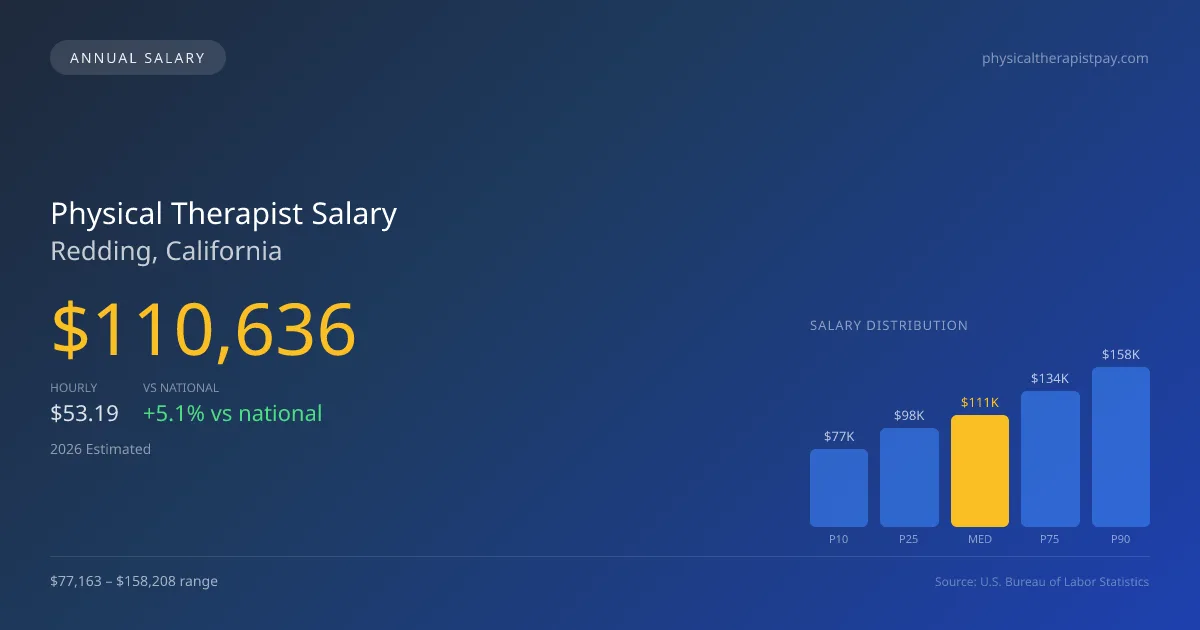
Physical therapists in Redding, California, can expect a median annual salary of $110,636 in 2026, reflecting a competitive edge of 5.08% over the national median of $105,288. The salary range for physical therapist pay in Redding, CA, varies significantly, from $77,163 at the 10th percentile to $158,208 at the 90th percentile. This data, derived from official Bureau of Labor Statistics (BLS) OEWS surveys, highlights the potential for lucrative earnings, particularly for those specializing in cash-pay or orthopedic settings. As outpatient orthopedic clinics and cash-pay models gain popularity, they can push compensation to the higher end of the spectrum in the local job market.
Salary Breakdown
| Percentile | Annual | Hourly |
|---|---|---|
| Entry Level (P10) | $77,163 | $37.10 |
| Lower Range (P25) | $98,321 | $47.26 |
| Median (P50)(typical) | $110,636 | $53.19 |
| Upper Range (P75) | $134,356 | $64.59 |
| Top Earners (P90) | $158,208 | $76.07 |
Median Salary Position
5.08% above the national average
2026 Salary Percentile Distribution in Redding
In Redding, CA, the physical therapist salary spread from the 10th to 90th percentile is $81,045 (2026 est.). At $110,636, the local median is 5.08% above the national median of $105,288.
Salary Calculator
At 40 hours/week in Redding: You'd be in the lower-middle range
How Redding Physical Therapist Pay Compares
Redding median: $110,636/year (2026)
| Compared To | Median Salary | Redding Pays |
|---|---|---|
| California Average | $128,647 | -14.00% less |
| National Average | $105,288 | +5.08% more |
Physical Therapists in Redding, CA earn a median of $110,636 per year (2026 est.), which is 5.08% higher than the national median of $105,288 and 14.00% below the California state average of $128,647.
Cost-of-Living Adjusted Salary
Redding has a cost of living 0.68% above the national average.
Adjusted salary = nominal × (100 / CoL index). CoL index: 100 = national average.
Redding, CA has a cost-of-living index of 100.684 (above the national average of 100). While the nominal salary of $110,636 is competitive, the higher cost of living reduces purchasing power to an effective $109,884 — a 0.68% reduction.
Compare Purchasing Power
Select a city to see how your salary compares after cost of living
Select a city above to compare purchasing power
2019 BLS Actual
$99,780
2025 BLS Actual
$107,980
2026 Current Est.
$110,636
2019–2027 Growth
+13.6%
Salary Trajectory for Physical Therapists in Redding (2019–2027)
2019–2025: actual BLS OEWS data for this metro area. 2026+: CAGR 2.46% projection.
| Year | Annual Salary | Status |
|---|---|---|
| 2019 | $99,780 | Actual |
| 2020 | $99,270 | Actual |
| 2021 | $96,530 | Actual |
| 2022 | $101,180 | Actual |
| 2023 | $100,750 | Actual |
| 2024 | $113,150 | Actual |
| 2025 | $107,980 | Actual |
| 2026(current) | $110,636 | Estimated |
| 2027 | $113,358 | Projected |
Based on 7 years of BLS OEWS data for the Redding metropolitan area, the median physical therapist salary grew 8.2% from $99,780 (2019) to $107,980 (2025). At a 2.46% compound annual growth rate, salaries are projected to reach $113,358 by 2027 — a total increase of $13,578 (13.61%) from 2019.
Note: Historical values (2019–2025) are actual BLS OEWS figures for the Redding metropolitan area, sourced from annual Occupational Employment and Wage Statistics surveys. 2026–2026 figures are current estimates, and 2027 values are projections, calculated using a 2.46% CAGR derived from 7-year BLS historical data. Actual salaries may vary based on employer, experience, certifications, and local market conditions.
Salary by Experience Level
| Experience | Estimated Salary Range |
|---|---|
| 0-2 years (New Graduate) | $77,163 – $98,321 |
| 3-5 years (Mid Career) | $98,321 – $110,636 |
| 5+ years (Experienced) | $110,636 – $134,356 |
| 10+ years (Top Earner) | $134,356 – $158,208 |
PT salary ranges estimated from BLS percentile data. Individual physical therapist compensation varies by employer, certifications, and specialization.
Physical Therapist Job Market in Redding
A strong local job market supports around 150 physical therapists actively working in Redding, CA. However, with a cost-of-living index of 100.684, the take-home purchasing power for these professionals can be affected. Outpatient clinics, notably chains like ATI and Athletico, often lead in pay, but hospital-affiliated rehab and specialized sports medicine facilities might offer competitive alternatives. Factors such as productivity expectations—often tied to insurance models—along with potential stipends for board certifications like OCS or SCS, contribute to variations in earnings. Additionally, those engaged in traveling PT roles may see enhanced payouts due to the flexibility and demand variations. For physical therapists looking to maximize their income, pursuing specialized certifications and considering cash-based practice may yield the best results in the Redding area.
More salary data for Redding, CA:
Frequently Asked Questions
How much do physical therapists make in Redding, CA in 2026?
Is Redding, CA a good place to work as a physical therapist?
Can physical therapists make $100K in Redding?
What is the cost-of-living adjusted physical therapist salary in Redding?
How much does a physical therapist make per hour in Redding?
Related Pages
Compare Salaries
Career Resources
Nearby Cities in California
Written by Alex Morgan, DPT
Career Analyst
Alex Morgan has over 10 years of experience in physical therapy. They specialize in orthopedic rehabilitation. Alex works in a private practice setting.
Methodology & Data Source
Salary figures on this page are 2026 projections based on the Bureau of Labor Statistics Occupational Employment and Wage Statistics (OEWS) survey, May 2026 release. The BLS reported a median annual salary of $107,980 for physical therapistsin the Redding metropolitan area. A 2.46% compound annual growth rate (CAGR), calculated from 6-year national BLS wage trends, was applied to project current 2026 compensation. Percentile ranges (P10–P90) represent the full salary distribution across experience levels and practice settings in this market.
Data Sources & Methodology
Source: BLS, OEWS, 7-year dataset (–). Per-city data from annual BLS metropolitan area surveys.
2026 figures are projected from 2025 BLS data using a compound annual growth rate (CAGR) of 2.46%, derived from historical BLS wage trends for physical therapists (SOC 29-1123).
Compiled and verified by Alex Morgan, DPT, a licensed physical therapist with 10+ years of clinical experience. · View source data at BLS.gov