Physical Therapist Salary in Sacramento, CA: $134,663 (2026)
Quick Answer:A full-time physical therapist in Sacramento, CA earns a median $134,663/year (≈ $64.74/hour) in nominal terms for 2026 — projected from BLS OEWS 2025 (SOC 29-1123). Once you factor in Sacramento's price level (7% above national, BEA RPP 106.7), that paycheck buys what $126,243 would nationally. Nominal pay sits 4.7% above the California state average.
Official BLS data · View source
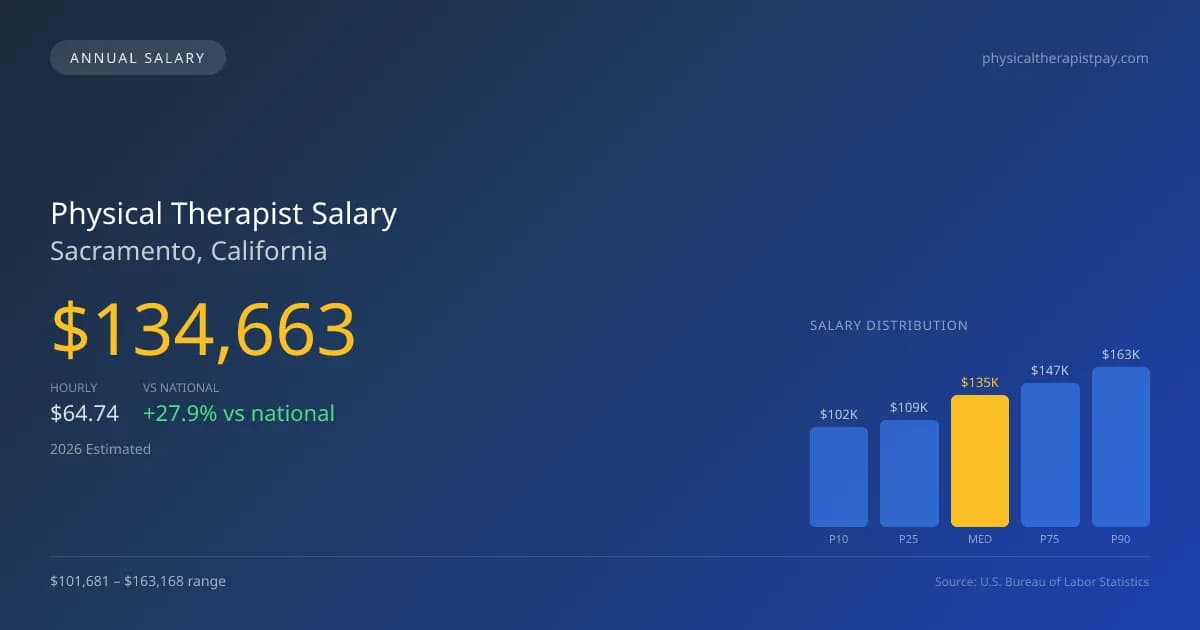
In 2026, physical therapists in Sacramento, California, are projected to earn a median annual salary of $134,663, significantly higher than the national median of $105,288, representing a 27.90% premium. The salary range for this profession varies widely, with estimates spanning from $101,681 at the 10th percentile to $163,168 at the 90th percentile. Derived from official Bureau of Labor Statistics (BLS) OEWS surveys, these figures reflect the current demand for skilled therapists in various settings. Sacramento's healthcare market includes a mix of outpatient orthopedic clinics, hospital systems, skilled nursing facilities, and home health agencies, each influencing pay differently.
Salary Breakdown
| Percentile | Annual | Hourly |
|---|---|---|
| Entry Level (P10) | $101,681 | $48.88 |
| Lower Range (P25) | $108,843 | $52.33 |
| Median (P50)(typical) | $134,663 | $64.74 |
| Upper Range (P75) | $147,112 | $70.73 |
| Top Earners (P90) | $163,168 | $78.44 |
Median Salary Position
27.90% above the national average
2026 Salary Percentile Distribution in Sacramento
In Sacramento, CA, the physical therapist salary spread from the 10th to 90th percentile is $61,487 (2026 est.). At $134,663, the local median is 27.9% above the national median of $105,288.
Salary Calculator
At 40 hours/week in Sacramento: You'd be above the median
How Sacramento Physical Therapist Pay Compares
Sacramento median: $134,663/year (2026)
| Compared To | Median Salary | Sacramento Pays |
|---|---|---|
| California Average | $128,618 | +4.70% more |
| National Average | $105,288 | +27.90% more |
Physical Therapists in Sacramento, CA earn a median of $134,663 per year (2026 est.), which is 27.90% higher than the national median of $105,288 and 4.70% above the California state average of $128,618.
Cost-of-Living Adjusted Salary
Sacramento has a cost of living 6.67% above the national average.
Adjusted salary = nominal × (100 / CoL index). CoL index: 100 = national average.
Sacramento, CA has a cost-of-living index of 106.67 (above the national average of 100). While the nominal salary of $134,663 is competitive, the higher cost of living reduces purchasing power to an effective $126,243 — a 6.25% reduction.
Compare Purchasing Power
Select a city to see how your salary compares after cost of living
Select a city above to compare purchasing power
2019 BLS Actual
$107,420
2025 BLS Actual
$131,430
2026 Current Est.
$134,663
2019–2027 Growth
+28.4%
Salary Trajectory for Physical Therapists in Sacramento (2019–2027)
2019–2025: actual BLS OEWS data for this metro area. 2026+: CAGR 2.46% projection.
| Year | Annual Salary | Status |
|---|---|---|
| 2019 | $107,420 | Actual |
| 2020 | $116,660 | Actual |
| 2021 | $102,370 | Actual |
| 2022 | $125,250 | Actual |
| 2023 | $131,760 | Actual |
| 2024 | $130,160 | Actual |
| 2025 | $131,430 | Actual |
| 2026(current) | $134,663 | Estimated |
| 2027 | $137,976 | Projected |
Based on 7 years of BLS OEWS data for the Sacramento metropolitan area, the median physical therapist salary grew 22.4% from $107,420 (2019) to $131,430 (2025). At a 2.46% compound annual growth rate, salaries are projected to reach $137,976 by 2027 — a total increase of $30,556 (28.45%) from 2019.
Note: Historical values (2019–2025) are actual BLS OEWS figures for the Sacramento metropolitan area, sourced from annual Occupational Employment and Wage Statistics surveys. 2026–2026 figures are current estimates, and 2027 values are projections, calculated using a 2.46% CAGR derived from 7-year BLS historical data. Actual salaries may vary based on employer, experience, certifications, and local market conditions.
Salary by Experience Level
| Experience | Estimated Salary Range |
|---|---|
| 0-2 years (New Graduate) | $101,681 – $108,843 |
| 3-5 years (Mid Career) | $108,843 – $134,663 |
| 5+ years (Experienced) | $134,663 – $147,112 |
| 10+ years (Top Earner) | $147,112 – $163,168 |
PT salary ranges estimated from BLS percentile data. Individual physical therapist compensation varies by employer, certifications, and specialization.
Physical Therapist Job Market in Sacramento
The job market for physical therapists in the Sacramento area remains robust, with approximately 1,610 individuals currently employed in this field. However, the cost of living is slightly above the national average, with a cost-of-living index of 106.67, impacting real purchasing power. Outpatient clinics, particularly larger chains like ATI and Athletico, typically offer lower salaries than hospital systems. Factors driving the pay disparity include productivity expectations, the impact of board certifications such as the OCS or SCS on compensation, and the clinic's payment model, whether cash-pay or insurance-based. To maximize physical therapist pay in Sacramento, professionals should focus on enhancing their productivity and pursuing specialized certifications, which can lead to greater earnings in this evolving healthcare landscape.
More salary data for Sacramento, CA:
Frequently Asked Questions
How much do physical therapists make in Sacramento, CA in 2026?
Is Sacramento, CA a good place to work as a physical therapist?
Can physical therapists make $100K in Sacramento?
What is the cost-of-living adjusted physical therapist salary in Sacramento?
How much does a physical therapist make per hour in Sacramento?
Related Pages
Compare Salaries
Career Resources
Nearby Cities in California
Written by Alex Morgan, DPT
Career Analyst
Alex Morgan has over 10 years of experience in physical therapy. They specialize in orthopedic rehabilitation. Alex works in a private practice setting.
Methodology & Data Source
Salary figures on this page are 2026 projections based on the Bureau of Labor Statistics Occupational Employment and Wage Statistics (OEWS) survey, May 2026 release. The BLS reported a median annual salary of $131,430 for physical therapistsin the Sacramento metropolitan area. A 2.46% compound annual growth rate (CAGR), calculated from 6-year national BLS wage trends, was applied to project current 2026 compensation. Percentile ranges (P10–P90) represent the full salary distribution across experience levels and practice settings in this market.
Data Sources & Methodology
Source: BLS, OEWS, 7-year dataset (–). Per-city data from annual BLS metropolitan area surveys.
2026 figures are projected from 2025 BLS data using a compound annual growth rate (CAGR) of 2.46%, derived from historical BLS wage trends for physical therapists (SOC 29-1123).
Compiled and verified by Alex Morgan, DPT, a licensed physical therapist with 10+ years of clinical experience. · View source data at BLS.gov