Physical Therapist Salary in San Ramon, CA: $128,437 (2026)
Quick Answer:A full-time physical therapist in San Ramon, CA earns a median $128,437/year (≈ $61.75/hour) in nominal terms for 2026 — projected from BLS OEWS 2025 (SOC 29-1123). Once you factor in San Ramon's price level (13% above national, BEA RPP 113.1), that paycheck buys what $113,561 would nationally. Nominal pay sits 0.1% below the California state average.
Based on BLS state-level estimates · View source
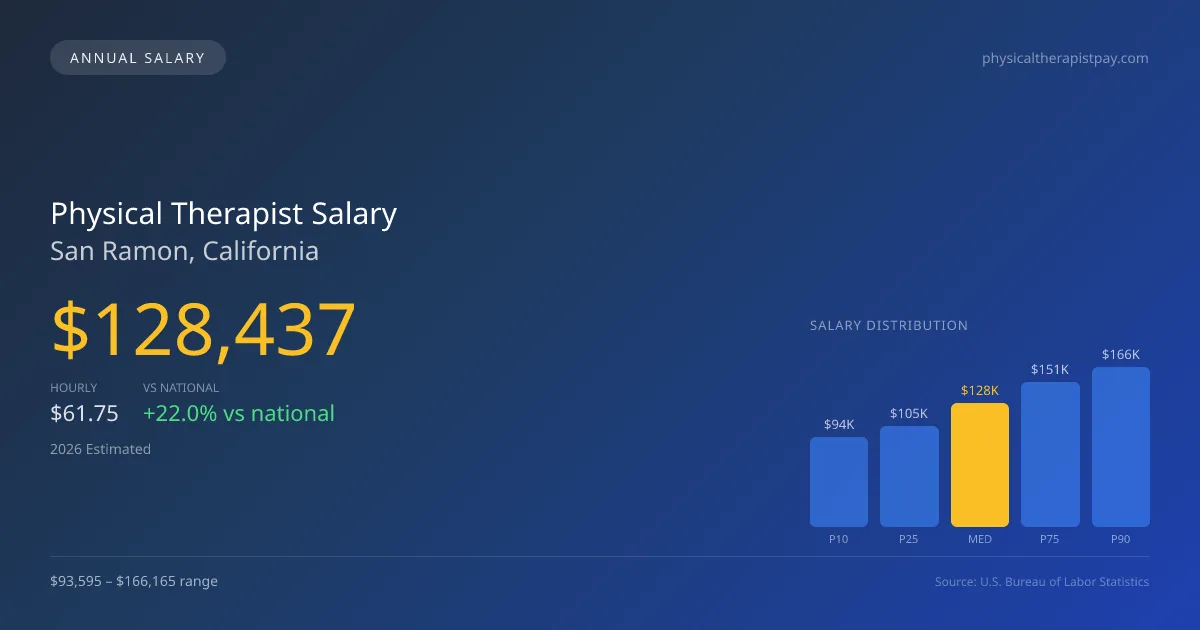
In 2026, physical therapists in San Ramon can expect a median annual salary of $128,437, reflecting a growing demand for skilled professionals in this dynamic healthcare market. The compensation for physical therapists in the area ranges from a lower threshold of $93,595 (P10) to as much as $166,165 (P90), illustrating a diverse income potential depending on the work environment and specific role. Local estimates derived from 2025 BLS data, adjusted for regional cost factors, indicate that physical therapist salaries in San Ramon CA are notably higher than the national median of $105,288, by about 21.99%. As outpatient chains continue to compete with hospital systems and skilled nursing facilities, understanding these pay scales can influence job choices and career paths in San Ramon's evolving healthcare sector.
About the San Ramon Market
Salary estimated from California average ($109,000) adjusted for local cost of living.
Salary Breakdown
| Percentile | Annual | Hourly |
|---|---|---|
| Entry Level (P10) | $93,595 | $45.00 |
| Lower Range (P25) | $104,613 | $50.30 |
| Median (P50)(typical) | $128,437 | $61.75 |
| Upper Range (P75) | $150,750 | $72.48 |
| Top Earners (P90) | $166,165 | $79.89 |
Median Salary Position
21.99% above the national average
2026 Salary Percentile Distribution in San Ramon
In San Ramon, CA, the physical therapist salary spread from the 10th to 90th percentile is $72,570 (2026 est.). At $128,437, the local median is 21.99% above the national median of $105,288.
Salary Calculator
At 40 hours/week in San Ramon: You'd be in the lower-middle range
How San Ramon Physical Therapist Pay Compares
San Ramon median: $128,437/year (2026)
| Compared To | Median Salary | San Ramon Pays |
|---|---|---|
| California Average | $128,565 | -0.10% less |
| National Average | $105,288 | +21.99% more |
Physical Therapists in San Ramon, CA earn a median of $128,437 per year (2026 est.), which is 21.99% higher than the national median of $105,288 and 0.10% below the California state average of $128,565.
Cost-of-Living Adjusted Salary
San Ramon has a cost of living 13.10% above the national average.
Adjusted salary = nominal × (100 / CoL index). CoL index: 100 = national average.
San Ramon, CA has a cost-of-living index of 113.1 (above the national average of 100). While the nominal salary of $128,437 is competitive, the higher cost of living reduces purchasing power to an effective $113,561 — a 11.58% reduction.
Compare Purchasing Power
Select a city to see how your salary compares after cost of living
Select a city above to compare purchasing power
2019 BLS Actual
$109,104
2025 BLS Actual
$125,353
2026 Current Est.
$128,437
2019–2027 Growth
+20.6%
Salary Trajectory for Physical Therapists in San Ramon (2019–2027)
2019–2025: actual BLS OEWS data for this metro area. 2026+: CAGR 2.46% projection.
| Year | Annual Salary | Status |
|---|---|---|
| 2019 | $109,104 | Actual |
| 2020 | $111,020 | Actual |
| 2021 | $116,643 | Actual |
| 2022 | $119,205 | Actual |
| 2023 | $121,632 | Actual |
| 2024 | $123,145 | Actual |
| 2025 | $125,353 | Actual |
| 2026(current) | $128,437 | Estimated |
| 2027 | $131,596 | Projected |
Based on 7 years of BLS OEWS data for the San Ramon metropolitan area, the median physical therapist salary grew 14.9% from $109,104 (2019) to $125,353 (2025). At a 2.46% compound annual growth rate, salaries are projected to reach $131,596 by 2027 — a total increase of $22,492 (20.62%) from 2019.
Note: Historical values (2019–2025) are actual BLS OEWS figures for the San Ramon metropolitan area, sourced from annual Occupational Employment and Wage Statistics surveys. 2026–2026 figures are current estimates, and 2027 values are projections, calculated using a 2.46% CAGR derived from 7-year BLS historical data. Actual salaries may vary based on employer, experience, certifications, and local market conditions.
Salary by Experience Level
| Experience | Estimated Salary Range |
|---|---|
| 0-2 years (New Graduate) | $93,595 – $104,613 |
| 3-5 years (Mid Career) | $104,613 – $128,437 |
| 5+ years (Experienced) | $128,437 – $150,750 |
| 10+ years (Top Earner) | $150,750 – $166,165 |
PT salary ranges estimated from BLS percentile data. Individual physical therapist compensation varies by employer, certifications, and specialization.
Physical Therapist Job Market in San Ramon
Within the San Ramon job market, 19 physical therapists contribute to a vibrant community of healthcare providers, though the comparatively high cost of living, with a cost-of-living index of 113.1, may influence overall purchasing power. Employers that offer the most competitive salaries typically fall into sectors such as outpatient orthopedic clinics and hospital inpatient rehab settings, where productivity expectations often define pay structures. Factors like board certification stipends (e.g., OCS, SCS), travel PT premiums, and opportunities for cash-pay models versus insurance practices also contribute to the variation in salaries. Aspiring physical therapists should consider developing specialized skills and industry certifications to enhance their appeal and maximize their earnings potential in San Ramon, CA.
More salary data for San Ramon, CA:
Frequently Asked Questions
How much do physical therapists make in San Ramon, CA in 2026?
Is San Ramon, CA a good place to work as a physical therapist?
Can physical therapists make $100K in San Ramon?
What is the cost-of-living adjusted physical therapist salary in San Ramon?
How much does a physical therapist make per hour in San Ramon?
Related Pages
Compare Salaries
Career Resources
Nearby Cities in California
Written by Alex Morgan, DPT
Career Analyst
Alex Morgan has over 10 years of experience in physical therapy. They specialize in orthopedic rehabilitation. Alex works in a private practice setting.
Methodology & Data Source
Salary figures on this page are 2026 projections based on the Bureau of Labor Statistics Occupational Employment and Wage Statistics (OEWS) survey, May 2026 release. The BLS reported a median annual salary of $125,353 for physical therapistsin the San Ramon metropolitan area. A 2.46% compound annual growth rate (CAGR), calculated from 6-year national BLS wage trends, was applied to project current 2026 compensation. Percentile ranges (P10–P90) represent the full salary distribution across experience levels and practice settings in this market.
Data Sources & Methodology
Salary data for San Ramon is estimated from official BLS state-level occupational wage data (2025), adjusted for regional cost-of-living differences using BEA RPP (Regional Price Parities).
2026 figures are projected from 2025 BLS data using a compound annual growth rate (CAGR) of 2.46%, derived from historical BLS wage trends for physical therapists (SOC 29-1123).
Compiled and verified by Alex Morgan, DPT, a licensed physical therapist with 10+ years of clinical experience. · View source data at BLS.gov