Physical Therapist Salary in Turlock, CA: $125,738 (2026)
Quick Answer:A full-time physical therapist in Turlock, CA earns a median $125,738/year (≈ $60.45/hour) in nominal terms for 2026 — projected from BLS OEWS 2025 (SOC 29-1123). Once you factor in Turlock's price level (13% above national, BEA RPP 113.1), that paycheck buys what $111,174 would nationally. Nominal pay sits 2.2% below the California state average.
Based on BLS state-level estimates · View source
In Turlock, California, the projected median annual salary for physical therapists in 2026 stands at $125,738, which is notably higher than the national median of $105,288. Local salaries range from $97,294 at the 10th percentile to as much as $169,915 at the 90th percentile, reflecting the robust demand for specialized care driven by trends such as cash-pay practices in sports and orthopedic fields. These figures are estimated based on 2025 BLS data, accounting for local economic conditions, which indicates that the competitive hiring environment for physical therapists in Turlock can lead to lucrative opportunities for skilled practitioners. The growing emphasis on high-quality sports rehabilitation exposes a higher tier of earning potential, especially in outpatient orthopedic settings, creating lucrative avenues for those in the profession.
About the Turlock Market
Salary estimated from California average ($109,000) adjusted for local cost of living.
Salary Breakdown
| Percentile | Annual | Hourly |
|---|---|---|
| Entry Level (P10) | $97,294 | $46.77 |
| Lower Range (P25) | $106,760 | $51.32 |
| Median (P50)(typical) | $125,738 | $60.45 |
| Upper Range (P75) | $151,831 | $72.99 |
| Top Earners (P90) | $169,915 | $81.69 |
Median Salary Position
19.42% above the national average
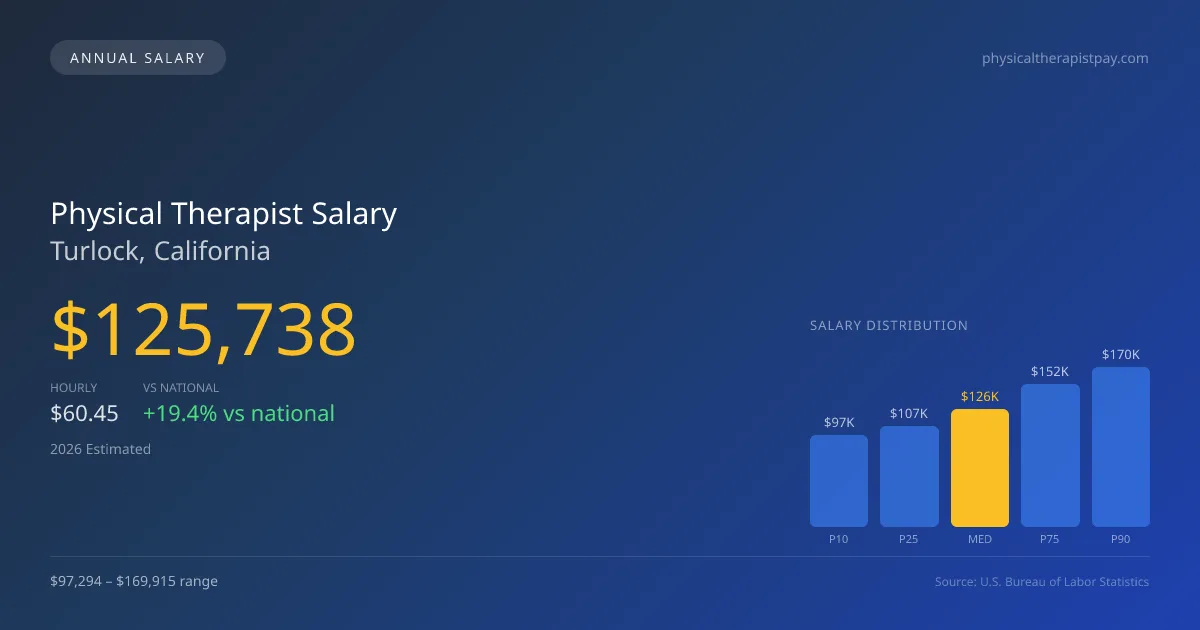
2026 Salary Percentile Distribution in Turlock
In Turlock, CA, the physical therapist salary spread from the 10th to 90th percentile is $72,621 (2026 est.). At $125,738, the local median is 19.42% above the national median of $105,288.
Salary Calculator
At 40 hours/week in Turlock: You'd be in the lower-middle range
How Turlock Physical Therapist Pay Compares
Turlock median: $125,738/year (2026)
| Compared To | Median Salary | Turlock Pays |
|---|---|---|
| California Average | $128,566 | -2.20% less |
| National Average | $105,288 | +19.42% more |
Physical Therapists in Turlock, CA earn a median of $125,738 per year (2026 est.), which is 19.42% higher than the national median of $105,288 and 2.20% below the California state average of $128,566.
Cost-of-Living Adjusted Salary
Turlock has a cost of living 13.10% above the national average.
Adjusted salary = nominal × (100 / CoL index). CoL index: 100 = national average.
Turlock, CA has a cost-of-living index of 113.1 (above the national average of 100). While the nominal salary of $125,738 is competitive, the higher cost of living reduces purchasing power to an effective $111,174 — a 11.58% reduction.
Compare Purchasing Power
Select a city to see how your salary compares after cost of living
Select a city above to compare purchasing power
2019 BLS Actual
$106,812
2025 BLS Actual
$122,719
2026 Current Est.
$125,738
2019–2027 Growth
+20.6%
Salary Trajectory for Physical Therapists in Turlock (2019–2027)
2019–2025: actual BLS OEWS data for this metro area. 2026+: CAGR 2.46% projection.
| Year | Annual Salary | Status |
|---|---|---|
| 2019 | $106,812 | Actual |
| 2020 | $108,687 | Actual |
| 2021 | $114,192 | Actual |
| 2022 | $116,700 | Actual |
| 2023 | $119,077 | Actual |
| 2024 | $120,557 | Actual |
| 2025 | $122,719 | Actual |
| 2026(current) | $125,738 | Estimated |
| 2027 | $128,831 | Projected |
Based on 7 years of BLS OEWS data for the Turlock metropolitan area, the median physical therapist salary grew 14.9% from $106,812 (2019) to $122,719 (2025). At a 2.46% compound annual growth rate, salaries are projected to reach $128,831 by 2027 — a total increase of $22,019 (20.61%) from 2019.
Note: Historical values (2019–2025) are actual BLS OEWS figures for the Turlock metropolitan area, sourced from annual Occupational Employment and Wage Statistics surveys. 2026–2026 figures are current estimates, and 2027 values are projections, calculated using a 2.46% CAGR derived from 7-year BLS historical data. Actual salaries may vary based on employer, experience, certifications, and local market conditions.
Salary by Experience Level
| Experience | Estimated Salary Range |
|---|---|
| 0-2 years (New Graduate) | $97,294 – $106,760 |
| 3-5 years (Mid Career) | $106,760 – $125,738 |
| 5+ years (Experienced) | $125,738 – $151,831 |
| 10+ years (Top Earner) | $151,831 – $169,915 |
PT salary ranges estimated from BLS percentile data. Individual physical therapist compensation varies by employer, certifications, and specialization.
Physical Therapist Job Market in Turlock
In Turlock, the job market for physical therapists is steady, with 17 professionals currently practicing in the area. While the cost-of-living index of 113.1 suggests that living expenses are above the national average, this also positions the local salaries favorably when assessing purchasing power. Among the various settings that employ physical therapists, outpatient orthopedic clinics often yield the highest salaries, although home health and specialized sports clinics are also competitive, particularly when cash-pay models are in play. To maximize earnings, practitioners should consider enhancing their credentials through board specializations such as OCS or SCS, which can provide a stipend and increase productivity expectations tied to compensation. The spread in pay among therapists is largely determined by clinical productivity metrics, patient visit quotas, and the choice between insurance-based versus cash-based practice models, where ownership stakes in clinics can also significantly boost income.
More salary data for Turlock, CA:
Frequently Asked Questions
How much do physical therapists make in Turlock, CA in 2026?
Is Turlock, CA a good place to work as a physical therapist?
Can physical therapists make $100K in Turlock?
What is the cost-of-living adjusted physical therapist salary in Turlock?
How much does a physical therapist make per hour in Turlock?
Related Pages
Compare Salaries
Career Resources
Nearby Cities in California
Written by Alex Morgan, DPT
Career Analyst
Alex Morgan has over 10 years of experience in physical therapy. They specialize in orthopedic rehabilitation. Alex works in a private practice setting.
Methodology & Data Source
Salary figures on this page are 2026 projections based on the Bureau of Labor Statistics Occupational Employment and Wage Statistics (OEWS) survey, May 2026 release. The BLS reported a median annual salary of $122,719 for physical therapistsin the Turlock metropolitan area. A 2.46% compound annual growth rate (CAGR), calculated from 6-year national BLS wage trends, was applied to project current 2026 compensation. Percentile ranges (P10–P90) represent the full salary distribution across experience levels and practice settings in this market.
Data Sources & Methodology
Salary data for Turlock is estimated from official BLS state-level occupational wage data (2025), adjusted for regional cost-of-living differences using BEA RPP (Regional Price Parities).
2026 figures are projected from 2025 BLS data using a compound annual growth rate (CAGR) of 2.46%, derived from historical BLS wage trends for physical therapists (SOC 29-1123).
Compiled and verified by Alex Morgan, DPT, a licensed physical therapist with 10+ years of clinical experience. · View source data at BLS.gov