Physical Therapist Salary in Woodland, CA: $130,229 (2026)
Quick Answer:A full-time physical therapist in Woodland, CA earns a median $130,229/year (≈ $62.61/hour) in nominal terms for 2026 — projected from BLS OEWS 2025 (SOC 29-1123). Once you factor in Woodland's price level (13% above national, BEA RPP 113.1), that paycheck buys what $115,145 would nationally. Nominal pay sits 1.3% above the California state average.
Based on BLS state-level estimates · View source
Physical therapists in Woodland, California, benefit from a competitive salary landscape, with a median annual compensation projected at $130,229 for 2026. This figure significantly surpasses the national median of $105,288, reflecting a local market that rewards specialists, particularly those focusing on cash-pay models in sports and orthopedic therapy. The salary range for professionals in this field spans from $97,702 at the 10th percentile to $172,150 at the 90th percentile, providing a broad spectrum of earning potential. These estimates are derived from 2025 BLS data, adjusted for regional price levels, and indicate that the dynamics of the Woodland job market favor those who can adapt to the evolving demands of patient care.
About the Woodland Market
Salary estimated from California average ($109,000) adjusted for local cost of living.
Salary Breakdown
| Percentile | Annual | Hourly |
|---|---|---|
| Entry Level (P10) | $97,702 | $46.97 |
| Lower Range (P25) | $108,273 | $52.05 |
| Median (P50)(typical) | $130,229 | $62.61 |
| Upper Range (P75) | $154,953 | $74.50 |
| Top Earners (P90) | $172,150 | $82.77 |
Median Salary Position
23.69% above the national average
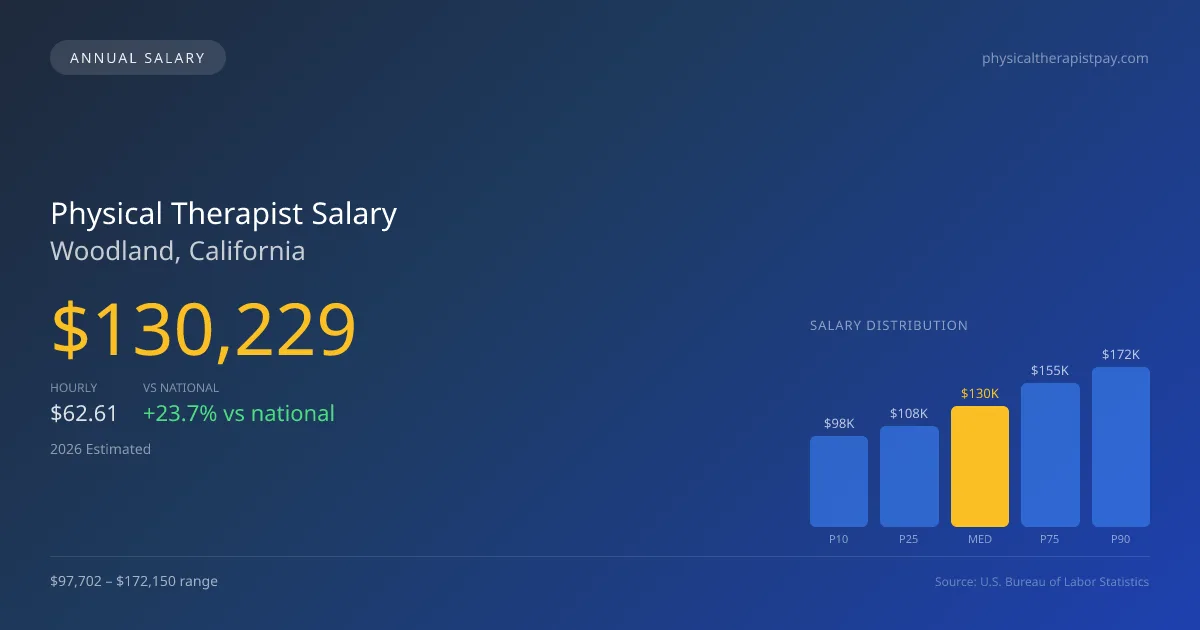
2026 Salary Percentile Distribution in Woodland
In Woodland, CA, the physical therapist salary spread from the 10th to 90th percentile is $74,448 (2026 est.). At $130,229, the local median is 23.69% above the national median of $105,288.
Salary Calculator
At 40 hours/week in Woodland: You'd be in the lower-middle range
How Woodland Physical Therapist Pay Compares
Woodland median: $130,229/year (2026)
| Compared To | Median Salary | Woodland Pays |
|---|---|---|
| California Average | $128,557 | +1.30% more |
| National Average | $105,288 | +23.69% more |
Physical Therapists in Woodland, CA earn a median of $130,229 per year (2026 est.), which is 23.69% higher than the national median of $105,288 and 1.30% above the California state average of $128,557.
Cost-of-Living Adjusted Salary
Woodland has a cost of living 13.10% above the national average.
Adjusted salary = nominal × (100 / CoL index). CoL index: 100 = national average.
Woodland, CA has a cost-of-living index of 113.1 (above the national average of 100). While the nominal salary of $130,229 is competitive, the higher cost of living reduces purchasing power to an effective $115,145 — a 11.58% reduction.
Compare Purchasing Power
Select a city to see how your salary compares after cost of living
Select a city above to compare purchasing power
2019 BLS Actual
$110,627
2025 BLS Actual
$127,102
2026 Current Est.
$130,229
2019–2027 Growth
+20.6%
Salary Trajectory for Physical Therapists in Woodland (2019–2027)
2019–2025: actual BLS OEWS data for this metro area. 2026+: CAGR 2.46% projection.
| Year | Annual Salary | Status |
|---|---|---|
| 2019 | $110,627 | Actual |
| 2020 | $112,569 | Actual |
| 2021 | $118,271 | Actual |
| 2022 | $120,868 | Actual |
| 2023 | $123,330 | Actual |
| 2024 | $124,863 | Actual |
| 2025 | $127,102 | Actual |
| 2026(current) | $130,229 | Estimated |
| 2027 | $133,432 | Projected |
Based on 7 years of BLS OEWS data for the Woodland metropolitan area, the median physical therapist salary grew 14.9% from $110,627 (2019) to $127,102 (2025). At a 2.46% compound annual growth rate, salaries are projected to reach $133,432 by 2027 — a total increase of $22,805 (20.61%) from 2019.
Note: Historical values (2019–2025) are actual BLS OEWS figures for the Woodland metropolitan area, sourced from annual Occupational Employment and Wage Statistics surveys. 2026–2026 figures are current estimates, and 2027 values are projections, calculated using a 2.46% CAGR derived from 7-year BLS historical data. Actual salaries may vary based on employer, experience, certifications, and local market conditions.
Salary by Experience Level
| Experience | Estimated Salary Range |
|---|---|
| 0-2 years (New Graduate) | $97,702 – $108,273 |
| 3-5 years (Mid Career) | $108,273 – $130,229 |
| 5+ years (Experienced) | $130,229 – $154,953 |
| 10+ years (Top Earner) | $154,953 – $172,150 |
PT salary ranges estimated from BLS percentile data. Individual physical therapist compensation varies by employer, certifications, and specialization.
Physical Therapist Job Market in Woodland
In Woodland, the employment landscape includes around 15 physical therapists, which may seem limited but suggests a niche market with opportunities for growth, particularly in outpatient orthopedic and sports medicine clinics. The cost of living index, sitting at 113.1, indicates higher living expenses relative to the national average, impacting purchasing power for physical therapist salaries. Employers such as outpatient orthopedic chains, skilled nursing facilities, and hospital rehabilitation departments typically drive pricing up, with many organizations looking to recruit therapists who are willing to meet higher productivity benchmarks or who possess board specialties like OCS or SCS. Maximizing pay locally may involve developing skills in cash-pay practice models, enhancing clinical certifications, and strategically negotiating salary based on expected workloads and clinic profitability. Understanding these market nuances will help current DPTs and future PTs navigate the job opportunities specific to Woodland, CA.
More salary data for Woodland, CA:
Frequently Asked Questions
How much do physical therapists make in Woodland, CA in 2026?
Is Woodland, CA a good place to work as a physical therapist?
Can physical therapists make $100K in Woodland?
What is the cost-of-living adjusted physical therapist salary in Woodland?
How much does a physical therapist make per hour in Woodland?
Related Pages
Compare Salaries
Career Resources
Nearby Cities in California
Written by Alex Morgan, DPT
Career Analyst
Alex Morgan has over 10 years of experience in physical therapy. They specialize in orthopedic rehabilitation. Alex works in a private practice setting.
Methodology & Data Source
Salary figures on this page are 2026 projections based on the Bureau of Labor Statistics Occupational Employment and Wage Statistics (OEWS) survey, May 2026 release. The BLS reported a median annual salary of $127,102 for physical therapistsin the Woodland metropolitan area. A 2.46% compound annual growth rate (CAGR), calculated from 6-year national BLS wage trends, was applied to project current 2026 compensation. Percentile ranges (P10–P90) represent the full salary distribution across experience levels and practice settings in this market.
Data Sources & Methodology
Salary data for Woodland is estimated from official BLS state-level occupational wage data (2025), adjusted for regional cost-of-living differences using BEA RPP (Regional Price Parities).
2026 figures are projected from 2025 BLS data using a compound annual growth rate (CAGR) of 2.46%, derived from historical BLS wage trends for physical therapists (SOC 29-1123).
Compiled and verified by Alex Morgan, DPT, a licensed physical therapist with 10+ years of clinical experience. · View source data at BLS.gov