Physical Therapist Salary in Naples, FL: $108,034 (2026)
Quick Answer:A full-time physical therapist in Naples, FL earns a median $108,034/year (≈ $51.94/hour) in nominal terms for 2026 — projected from BLS OEWS 2025 (SOC 29-1123). Once you factor in Naples's price level (3% above national, BEA RPP 103.2), that paycheck buys what $104,684 would nationally. Nominal pay sits 5.3% above the Florida state average.
Official BLS data · View source
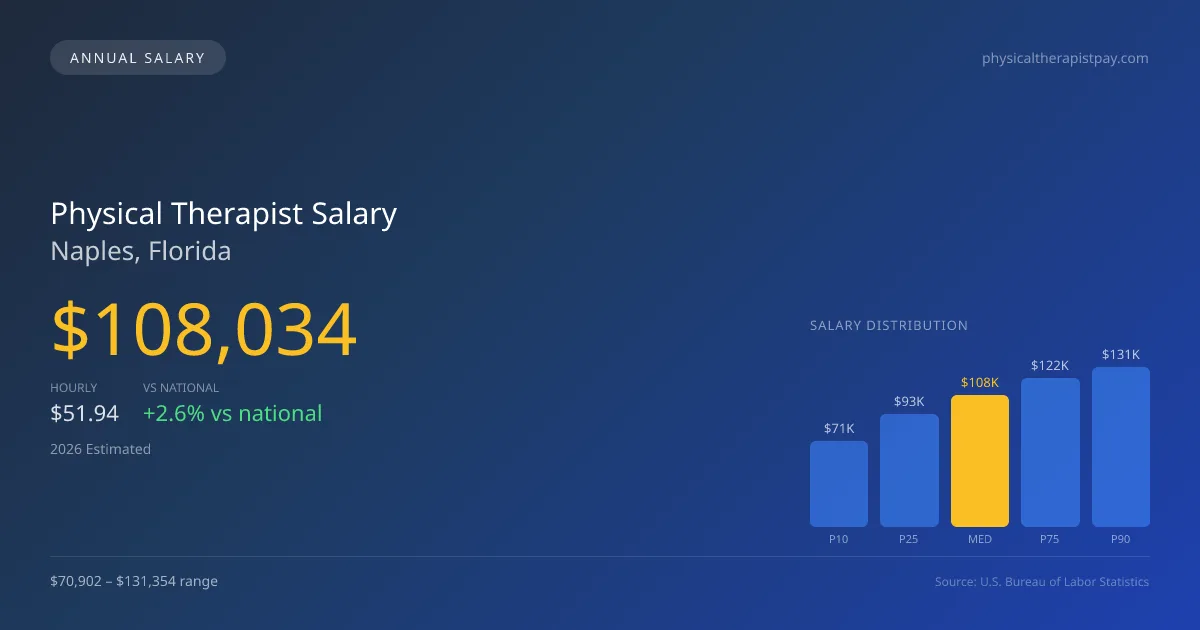
In Naples, Florida, physical therapists can expect a median annual salary of $108,034 in 2026, reflecting a 2.61% increase over national figures. The salary range for this profession in the city spans from $70,902 at the lower end (P10) to $131,354 at the upper end (P90). These insights are derived from comprehensive surveys conducted by the Bureau of Labor Statistics (BLS), offering a reliable outlook on compensation trends. As healthcare practices evolve in Naples, particularly with outpatient orthopedic facilities and other rehab centers, the pressures on therapists to meet visits-per-day targets continue to shape effective hourly compensation.
Salary Breakdown
| Percentile | Annual | Hourly |
|---|---|---|
| Entry Level (P10) | $70,902 | $34.09 |
| Lower Range (P25) | $92,501 | $44.48 |
| Median (P50)(typical) | $108,034 | $51.94 |
| Upper Range (P75) | $122,378 | $58.83 |
| Top Earners (P90) | $131,354 | $63.15 |
Median Salary Position
2.61% above the national average
2026 Salary Percentile Distribution in Naples
In Naples, FL, the physical therapist salary spread from the 10th to 90th percentile is $60,452 (2026 est.). At $108,034, the local median is 2.61% above the national median of $105,288.
Salary Calculator
At 40 hours/week in Naples: You'd be above the median
How Naples Physical Therapist Pay Compares
Naples median: $108,034/year (2026)
| Compared To | Median Salary | Naples Pays |
|---|---|---|
| Florida Average | $102,596 | +5.30% more |
| National Average | $105,288 | +2.61% more |
Physical Therapists in Naples, FL earn a median of $108,034 per year (2026 est.), which is 2.61% higher than the national median of $105,288 and 5.30% above the Florida state average of $102,596.
Cost-of-Living Adjusted Salary
Naples has a cost of living 3.20% above the national average.
Adjusted salary = nominal × (100 / CoL index). CoL index: 100 = national average.
Naples, FL has a cost-of-living index of 103.2 (above the national average of 100). While the nominal salary of $108,034 is competitive, the higher cost of living reduces purchasing power to an effective $104,684 — a 3.1% reduction.
Compare Purchasing Power
Select a city to see how your salary compares after cost of living
Select a city above to compare purchasing power
2019 BLS Actual
$92,100
2025 BLS Actual
$105,440
2026 Current Est.
$108,034
2019–2027 Growth
+20.2%
Salary Trajectory for Physical Therapists in Naples (2019–2027)
2019–2025: actual BLS OEWS data for this metro area. 2026+: CAGR 2.46% projection.
| Year | Annual Salary | Status |
|---|---|---|
| 2019 | $92,100 | Actual |
| 2020 | $88,160 | Actual |
| 2021 | $102,930 | Actual |
| 2022 | $100,640 | Actual |
| 2023 | $104,590 | Actual |
| 2024 | $106,040 | Actual |
| 2025 | $105,440 | Actual |
| 2026(current) | $108,034 | Estimated |
| 2027 | $110,691 | Projected |
Based on 7 years of BLS OEWS data for the Naples metropolitan area, the median physical therapist salary grew 14.5% from $92,100 (2019) to $105,440 (2025). At a 2.46% compound annual growth rate, salaries are projected to reach $110,691 by 2027 — a total increase of $18,591 (20.19%) from 2019.
Note: Historical values (2019–2025) are actual BLS OEWS figures for the Naples metropolitan area, sourced from annual Occupational Employment and Wage Statistics surveys. 2026–2026 figures are current estimates, and 2027 values are projections, calculated using a 2.46% CAGR derived from 7-year BLS historical data. Actual salaries may vary based on employer, experience, certifications, and local market conditions.
Salary by Experience Level
| Experience | Estimated Salary Range |
|---|---|
| 0-2 years (New Graduate) | $70,902 – $92,501 |
| 3-5 years (Mid Career) | $92,501 – $108,034 |
| 5+ years (Experienced) | $108,034 – $122,378 |
| 10+ years (Top Earner) | $122,378 – $131,354 |
PT salary ranges estimated from BLS percentile data. Individual physical therapist compensation varies by employer, certifications, and specialization.
Physical Therapist Job Market in Naples
With about 300 physical therapists currently employed in Naples, the local job market presents both opportunities and challenges. The cost of living index in the area is slightly above the national average at 103.2, which can affect take-home pay and purchasing power for professionals in the field. Employers such as outpatient clinics and skilled nursing facilities often lead in offering competitive pay. Factors influencing the disparity in salaries include productivity expectations, certification stipends for advanced qualifications like OCS or SCS, and the model of practice—whether cash-based or insurance-driven. For those aiming to maximize their earnings, networking within the local community, considering travel PT options, and pursuing board specializations can enhance career prospects significantly in the Naples market.
More salary data for Naples, FL:
Frequently Asked Questions
How much do physical therapists make in Naples, FL in 2026?
Is Naples, FL a good place to work as a physical therapist?
Can physical therapists make $100K in Naples?
What is the cost-of-living adjusted physical therapist salary in Naples?
How much does a physical therapist make per hour in Naples?
Related Pages
Compare Salaries
Career Resources
Nearby Cities in Florida
Written by Alex Morgan, DPT
Career Analyst
Alex Morgan has over 10 years of experience in physical therapy. They specialize in orthopedic rehabilitation. Alex works in a private practice setting.
Methodology & Data Source
Salary figures on this page are 2026 projections based on the Bureau of Labor Statistics Occupational Employment and Wage Statistics (OEWS) survey, May 2026 release. The BLS reported a median annual salary of $105,440 for physical therapistsin the Naples metropolitan area. A 2.46% compound annual growth rate (CAGR), calculated from 6-year national BLS wage trends, was applied to project current 2026 compensation. Percentile ranges (P10–P90) represent the full salary distribution across experience levels and practice settings in this market.
Data Sources & Methodology
Source: BLS, OEWS, 7-year dataset (–). Per-city data from annual BLS metropolitan area surveys.
2026 figures are projected from 2025 BLS data using a compound annual growth rate (CAGR) of 2.46%, derived from historical BLS wage trends for physical therapists (SOC 29-1123).
Compiled and verified by Alex Morgan, DPT, a licensed physical therapist with 10+ years of clinical experience. · View source data at BLS.gov