Physical Therapist Salary in Valdosta, GA: $99,437 (2026)
Quick Answer:A full-time physical therapist in Valdosta, GA earns a median $99,437/year (≈ $47.81/hour) in nominal terms for 2026 — projected from BLS OEWS 2025 (SOC 29-1123). Once you factor in Valdosta's price level (12% below national, BEA RPP 88.3), that paycheck buys what $112,650 would nationally. Nominal pay sits 3.8% below the Georgia state average.
Official BLS data · View source
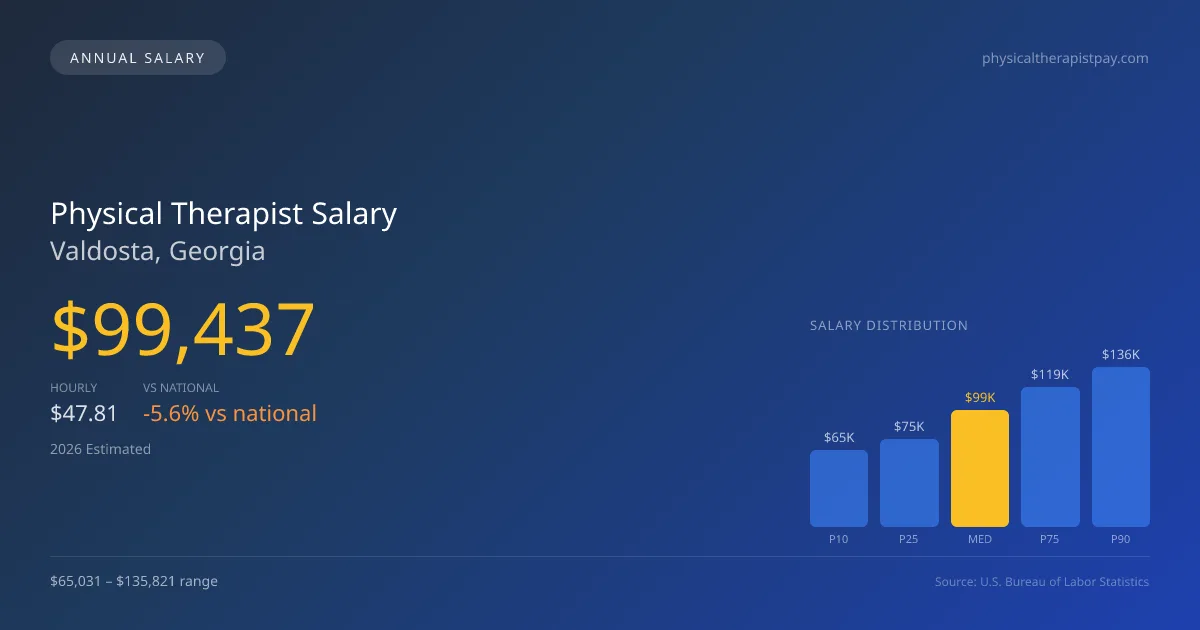
In Valdosta, Georgia, the projected median annual salary for physical therapists is $99,437 in 2026, which is slightly lower than the national average of $105,288. This discrepancy reflects local market dynamics, specifically the rising trend of cash-pay models within sports and orthopedic specialties, which are contributing to higher compensation for top performers. The salary range for physical therapists in this area spans from $65,031 at the 10th percentile to $135,821 at the 90th percentile, demonstrating a notable variation based on experience, specialization, and practice settings. These figures are derived from official BLS OEWS surveys, indicating a growing field with room for advancement, especially for those who adapt well to cash-pay systems and optimize their practice productivity.
Salary Breakdown
| Percentile | Annual | Hourly |
|---|---|---|
| Entry Level (P10) | $65,031 | $31.27 |
| Lower Range (P25) | $74,837 | $35.98 |
| Median (P50)(typical) | $99,437 | $47.81 |
| Upper Range (P75) | $119,253 | $57.34 |
| Top Earners (P90) | $135,821 | $65.30 |
Median Salary Position
5.56% below the national average
2026 Salary Percentile Distribution in Valdosta
In Valdosta, GA, the physical therapist salary spread from the 10th to 90th percentile is $70,790 (2026 est.). At $99,437, the local median is 5.56% below the national median of $105,288.
Salary Calculator
At 40 hours/week in Valdosta: You'd be in the lower-middle range
How Valdosta Physical Therapist Pay Compares
Valdosta median: $99,437/year (2026)
| Compared To | Median Salary | Valdosta Pays |
|---|---|---|
| Georgia Average | $103,365 | -3.80% less |
| National Average | $105,288 | -5.56% less |
Physical Therapists in Valdosta, GA earn a median of $99,437 per year (2026 est.), which is 5.56% lower than the national median of $105,288 and 3.80% below the Georgia state average of $103,365.
Cost-of-Living Adjusted Salary
Valdosta has a cost of living 11.73% below the national average, meaning your salary goes further here.
Adjusted salary = nominal × (100 / CoL index). CoL index: 100 = national average.
Valdosta, GA has a cost-of-living index of 88.271 (below the national average of 100). A physical therapist earning $99,437 nominally has purchasing power equivalent to $112,650 in an average-cost city — an effective 13.29% boost.
Compare Purchasing Power
Select a city to see how your salary compares after cost of living
Select a city above to compare purchasing power
2019 BLS Actual
$88,710
2025 BLS Actual
$97,050
2026 Current Est.
$99,437
2019–2027 Growth
+14.9%
Salary Trajectory for Physical Therapists in Valdosta (2019–2027)
2019–2025: actual BLS OEWS data for this metro area. 2026+: CAGR 2.46% projection.
| Year | Annual Salary | Status |
|---|---|---|
| 2019 | $88,710 | Actual |
| 2020 | $98,300 | Actual |
| 2021 | $77,830 | Actual |
| 2022 | $84,890 | Actual |
| 2023 | $96,420 | Actual |
| 2024 | $98,260 | Actual |
| 2025 | $97,050 | Actual |
| 2026(current) | $99,437 | Estimated |
| 2027 | $101,884 | Projected |
Based on 7 years of BLS OEWS data for the Valdosta metropolitan area, the median physical therapist salary grew 9.4% from $88,710 (2019) to $97,050 (2025). At a 2.46% compound annual growth rate, salaries are projected to reach $101,884 by 2027 — a total increase of $13,174 (14.85%) from 2019.
Note: Historical values (2019–2025) are actual BLS OEWS figures for the Valdosta metropolitan area, sourced from annual Occupational Employment and Wage Statistics surveys. 2026–2026 figures are current estimates, and 2027 values are projections, calculated using a 2.46% CAGR derived from 7-year BLS historical data. Actual salaries may vary based on employer, experience, certifications, and local market conditions.
Salary by Experience Level
| Experience | Estimated Salary Range |
|---|---|
| 0-2 years (New Graduate) | $65,031 – $74,837 |
| 3-5 years (Mid Career) | $74,837 – $99,437 |
| 5+ years (Experienced) | $99,437 – $119,253 |
| 10+ years (Top Earner) | $119,253 – $135,821 |
PT salary ranges estimated from BLS percentile data. Individual physical therapist compensation varies by employer, certifications, and specialization.
Physical Therapist Job Market in Valdosta
The local employment situation features about 70 physical therapists currently practicing in the area, indicative of a stable job market despite the competitive landscape. Valdosta's cost-of-living index at 88.271 suggests that take-home salaries may stretch further than in higher-cost regions, enabling physical therapists to maintain a comfortable lifestyle. Employers vary significantly in how much they offer, with outpatient orthopedic clinics, including private practices and well-established chains like Athletico, leading the pay scale. However, productivity expectations are high, often tied to billing practices and patient volumes, which can influence earning potential. To maximize pay in this market, focusing on gaining board certifications—like the OCS or SCS—can provide a competitive edge. Additionally, exploring employment opportunities in skilled nursing facilities or travel physical therapy could yield higher wages and more diverse experiences for practitioners in Valdosta, GA.
More salary data for Valdosta, GA:
Frequently Asked Questions
How much do physical therapists make in Valdosta, GA in 2026?
Is Valdosta, GA a good place to work as a physical therapist?
Can physical therapists make $100K in Valdosta?
What is the cost-of-living adjusted physical therapist salary in Valdosta?
How much does a physical therapist make per hour in Valdosta?
Related Pages
Compare Salaries
Career Resources
Nearby Cities in Georgia
Written by Alex Morgan, DPT
Career Analyst
Alex Morgan has over 10 years of experience in physical therapy. They specialize in orthopedic rehabilitation. Alex works in a private practice setting.
Methodology & Data Source
Salary figures on this page are 2026 projections based on the Bureau of Labor Statistics Occupational Employment and Wage Statistics (OEWS) survey, May 2026 release. The BLS reported a median annual salary of $97,050 for physical therapistsin the Valdosta metropolitan area. A 2.46% compound annual growth rate (CAGR), calculated from 6-year national BLS wage trends, was applied to project current 2026 compensation. Percentile ranges (P10–P90) represent the full salary distribution across experience levels and practice settings in this market.
Data Sources & Methodology
Source: BLS, OEWS, 7-year dataset (–). Per-city data from annual BLS metropolitan area surveys.
2026 figures are projected from 2025 BLS data using a compound annual growth rate (CAGR) of 2.46%, derived from historical BLS wage trends for physical therapists (SOC 29-1123).
Compiled and verified by Alex Morgan, DPT, a licensed physical therapist with 10+ years of clinical experience. · View source data at BLS.gov