Physical Therapist Salary in Rexburg, ID: $94,483 (2026)
Quick Answer:A full-time physical therapist in Rexburg, ID earns a median $94,483/year (≈ $45.42/hour) in nominal terms for 2026 — projected from BLS OEWS 2025 (SOC 29-1123). Once you factor in Rexburg's price level (5% below national, BEA RPP 95.3), that paycheck buys what $99,143 would nationally. Nominal pay sits 0.9% below the Idaho state average.
Based on BLS state-level estimates · View source
Rexburg, ID offers a competitive compensation package for physical therapists, with a median annual salary projected to reach $94,483 in 2026. This amount sits below the national median for the same year, which is $105,288, reflecting local economic conditions and productivity pressures unique to the area. Salary ranges for physical therapists in Rexburg indicate that entry-level professionals may earn as little as $72,890, while experienced therapists can command upwards of $117,470, depending on experience and specialization. These figures are sourced from estimates based on 2025 BLS data, adjusted for regional price fluctuations, revealing a nuanced job market where the number of employed physical therapists stands at eight, underscoring a niche demand within the healthcare landscape.
About the Rexburg Market
Salary estimated from Idaho average ($90,000) adjusted for local cost of living.
Salary Breakdown
| Percentile | Annual | Hourly |
|---|---|---|
| Entry Level (P10) | $72,890 | $35.04 |
| Lower Range (P25) | $79,548 | $38.25 |
| Median (P50)(typical) | $94,483 | $45.42 |
| Upper Range (P75) | $108,552 | $52.19 |
| Top Earners (P90) | $117,470 | $56.48 |
Median Salary Position
10.26% below the national average
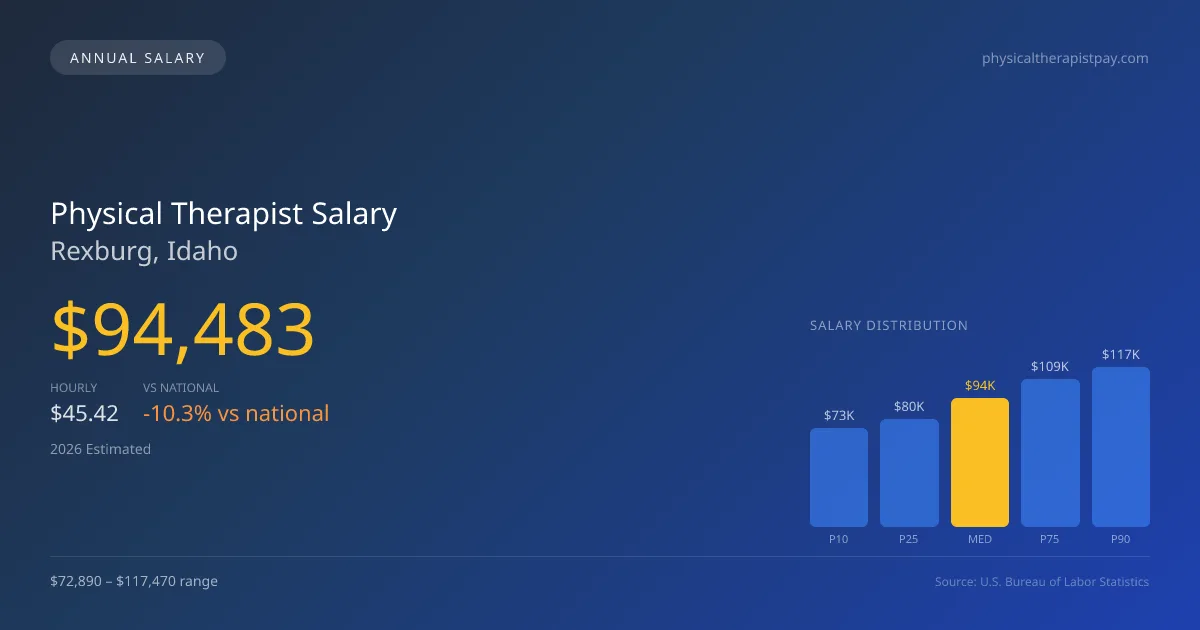
2026 Salary Percentile Distribution in Rexburg
In Rexburg, ID, the physical therapist salary spread from the 10th to 90th percentile is $44,580 (2026 est.). At $94,483, the local median is 10.26% below the national median of $105,288.
Salary Calculator
At 40 hours/week in Rexburg: You'd be in the lower-middle range
How Rexburg Physical Therapist Pay Compares
Rexburg median: $94,483/year (2026)
| Compared To | Median Salary | Rexburg Pays |
|---|---|---|
| Idaho Average | $95,342 | -0.90% less |
| National Average | $105,288 | -10.26% less |
Physical Therapists in Rexburg, ID earn a median of $94,483 per year (2026 est.), which is 10.26% lower than the national median of $105,288 and 0.90% below the Idaho state average of $95,342.
Cost-of-Living Adjusted Salary
Rexburg has a cost of living 4.70% below the national average, meaning your salary goes further here.
Adjusted salary = nominal × (100 / CoL index). CoL index: 100 = national average.
Rexburg, ID has a cost-of-living index of 95.3 (below the national average of 100). A physical therapist earning $94,483 nominally has purchasing power equivalent to $99,143 in an average-cost city — an effective 4.93% boost.
Compare Purchasing Power
Select a city to see how your salary compares after cost of living
Select a city above to compare purchasing power
2019 BLS Actual
$80,262
2025 BLS Actual
$92,215
2026 Current Est.
$94,483
2019–2027 Growth
+20.6%
Salary Trajectory for Physical Therapists in Rexburg (2019–2027)
2019–2025: actual BLS OEWS data for this metro area. 2026+: CAGR 2.46% projection.
| Year | Annual Salary | Status |
|---|---|---|
| 2019 | $80,262 | Actual |
| 2020 | $81,671 | Actual |
| 2021 | $85,808 | Actual |
| 2022 | $87,692 | Actual |
| 2023 | $89,478 | Actual |
| 2024 | $84,964 | Actual |
| 2025 | $92,215 | Actual |
| 2026(current) | $94,483 | Estimated |
| 2027 | $96,808 | Projected |
Based on 7 years of BLS OEWS data for the Rexburg metropolitan area, the median physical therapist salary grew 14.9% from $80,262 (2019) to $92,215 (2025). At a 2.46% compound annual growth rate, salaries are projected to reach $96,808 by 2027 — a total increase of $16,546 (20.61%) from 2019.
Note: Historical values (2019–2025) are actual BLS OEWS figures for the Rexburg metropolitan area, sourced from annual Occupational Employment and Wage Statistics surveys. 2026–2026 figures are current estimates, and 2027 values are projections, calculated using a 2.46% CAGR derived from 7-year BLS historical data. Actual salaries may vary based on employer, experience, certifications, and local market conditions.
Salary by Experience Level
| Experience | Estimated Salary Range |
|---|---|
| 0-2 years (New Graduate) | $72,890 – $79,548 |
| 3-5 years (Mid Career) | $79,548 – $94,483 |
| 5+ years (Experienced) | $94,483 – $108,552 |
| 10+ years (Top Earner) | $108,552 – $117,470 |
PT salary ranges estimated from BLS percentile data. Individual physical therapist compensation varies by employer, certifications, and specialization.
Physical Therapist Job Market in Rexburg
The local job market in Rexburg presents a unique context for physical therapist pay, with the cost of living index at 95.3 indicating affordability compared to national standards. This can enhance the effective purchasing power for those working in the area. Employers within outpatient orthopedic clinics, including larger chains and local private practices, generally offer the highest compensation, particularly for therapists who meet productivity goals or possess specialty certifications like OCS or SCS. Variability in pay can also stem from practice models, such as the contrast between cash-pay operations and insurance-based reimbursement, which can impact overall earnings potential. Therapists aiming to maximize their salaries in Rexburg should consider negotiating for performance-based bonuses and exploring opportunities in high-demand settings, such as sports medicine or home health agencies, where particularly strong demand exists.
More salary data for Rexburg, ID:
Frequently Asked Questions
How much do physical therapists make in Rexburg, ID in 2026?
Is Rexburg, ID a good place to work as a physical therapist?
Can physical therapists make $100K in Rexburg?
What is the cost-of-living adjusted physical therapist salary in Rexburg?
How much does a physical therapist make per hour in Rexburg?
Related Pages
Compare Salaries
Career Resources
Written by Alex Morgan, DPT
Career Analyst
Alex Morgan has over 10 years of experience in physical therapy. They specialize in orthopedic rehabilitation. Alex works in a private practice setting.
Methodology & Data Source
Salary figures on this page are 2026 projections based on the Bureau of Labor Statistics Occupational Employment and Wage Statistics (OEWS) survey, May 2026 release. The BLS reported a median annual salary of $92,215 for physical therapistsin the Rexburg metropolitan area. A 2.46% compound annual growth rate (CAGR), calculated from 6-year national BLS wage trends, was applied to project current 2026 compensation. Percentile ranges (P10–P90) represent the full salary distribution across experience levels and practice settings in this market.
Data Sources & Methodology
Salary data for Rexburg is estimated from official BLS state-level occupational wage data (2025), adjusted for regional cost-of-living differences using BEA RPP (Regional Price Parities).
2026 figures are projected from 2025 BLS data using a compound annual growth rate (CAGR) of 2.46%, derived from historical BLS wage trends for physical therapists (SOC 29-1123).
Compiled and verified by Alex Morgan, DPT, a licensed physical therapist with 10+ years of clinical experience. · View source data at BLS.gov