Physical Therapist Salary in Normal, IL: $99,889 (2026)
Quick Answer:A full-time physical therapist in Normal, IL earns a median $99,889/year (≈ $48.02/hour) in nominal terms for 2026 — projected from BLS OEWS 2025 (SOC 29-1123). Once you factor in Normal's price level (3% below national, BEA RPP 97.1), that paycheck buys what $102,872 would nationally. Nominal pay sits 3.0% below the Illinois state average.
Based on BLS state-level estimates · View source
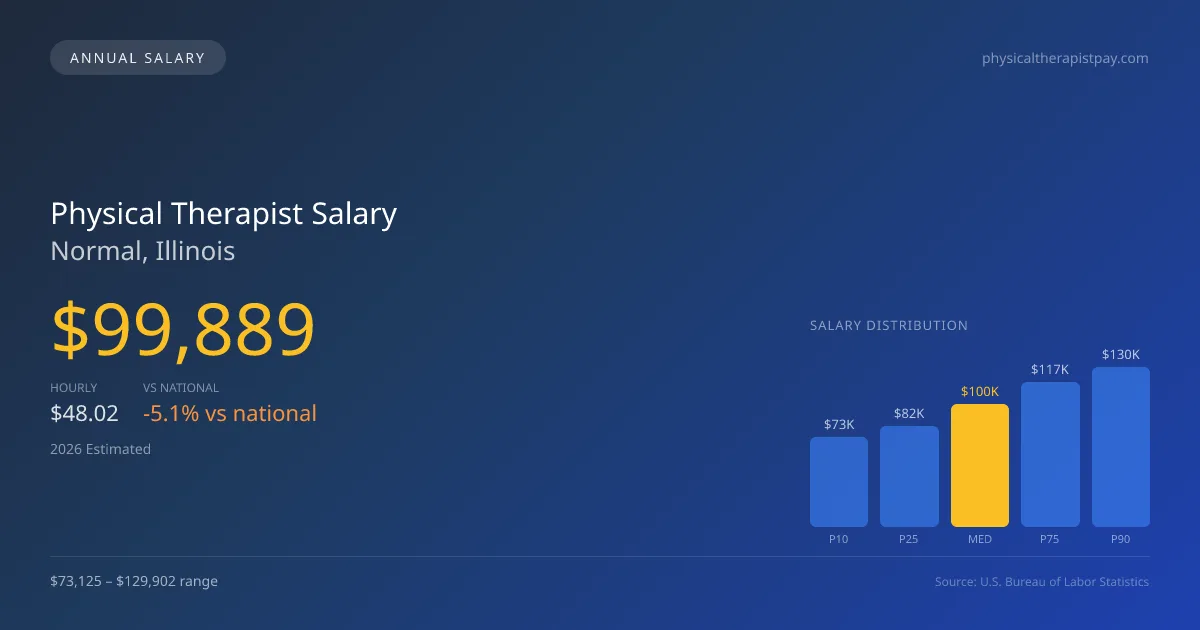
In 2026, physical therapists in Normal, Illinois, can expect a median annual salary of $99,889, which is slightly below the national median of $105,288. The projected salary range for physical therapy in this area varies significantly, encompassing figures from $73,125 at the 10th percentile to as high as $129,902 at the 90th percentile. These estimates, drawn from 2025 BLS data adjusted for regional cost factors, reflect both the opportunities and challenges within the local healthcare landscape. As productivity expectations rise, resulting in more visits per day, effective compensation structures become increasingly important in determining actual take-home pay for practitioners in Normal.
About the Normal Market
Salary estimated from Illinois average ($96,000) adjusted for local cost of living.
Salary Breakdown
| Percentile | Annual | Hourly |
|---|---|---|
| Entry Level (P10) | $73,125 | $35.15 |
| Lower Range (P25) | $81,609 | $39.23 |
| Median (P50)(typical) | $99,889 | $48.02 |
| Upper Range (P75) | $117,339 | $56.41 |
| Top Earners (P90) | $129,902 | $62.45 |
Median Salary Position
5.13% below the national average
2026 Salary Percentile Distribution in Normal
In Normal, IL, the physical therapist salary spread from the 10th to 90th percentile is $56,777 (2026 est.). At $99,889, the local median is 5.13% below the national median of $105,288.
Salary Calculator
At 40 hours/week in Normal: You'd be in the lower-middle range
How Normal Physical Therapist Pay Compares
Normal median: $99,889/year (2026)
| Compared To | Median Salary | Normal Pays |
|---|---|---|
| Illinois Average | $102,979 | -3.00% less |
| National Average | $105,288 | -5.13% less |
Physical Therapists in Normal, IL earn a median of $99,889 per year (2026 est.), which is 5.13% lower than the national median of $105,288 and 3.00% below the Illinois state average of $102,979.
Cost-of-Living Adjusted Salary
Normal has a cost of living 2.90% below the national average, meaning your salary goes further here.
Adjusted salary = nominal × (100 / CoL index). CoL index: 100 = national average.
Normal, IL has a cost-of-living index of 97.1 (below the national average of 100). A physical therapist earning $99,889 nominally has purchasing power equivalent to $102,872 in an average-cost city — an effective 2.99% boost.
Compare Purchasing Power
Select a city to see how your salary compares after cost of living
Select a city above to compare purchasing power
2019 BLS Actual
$84,854
2025 BLS Actual
$97,491
2026 Current Est.
$99,889
2019–2027 Growth
+20.6%
Salary Trajectory for Physical Therapists in Normal (2019–2027)
2019–2025: actual BLS OEWS data for this metro area. 2026+: CAGR 2.46% projection.
| Year | Annual Salary | Status |
|---|---|---|
| 2019 | $84,854 | Actual |
| 2020 | $86,343 | Actual |
| 2021 | $90,717 | Actual |
| 2022 | $92,709 | Actual |
| 2023 | $94,597 | Actual |
| 2024 | $90,375 | Actual |
| 2025 | $97,491 | Actual |
| 2026(current) | $99,889 | Estimated |
| 2027 | $102,347 | Projected |
Based on 7 years of BLS OEWS data for the Normal metropolitan area, the median physical therapist salary grew 14.9% from $84,854 (2019) to $97,491 (2025). At a 2.46% compound annual growth rate, salaries are projected to reach $102,347 by 2027 — a total increase of $17,493 (20.62%) from 2019.
Note: Historical values (2019–2025) are actual BLS OEWS figures for the Normal metropolitan area, sourced from annual Occupational Employment and Wage Statistics surveys. 2026–2026 figures are current estimates, and 2027 values are projections, calculated using a 2.46% CAGR derived from 7-year BLS historical data. Actual salaries may vary based on employer, experience, certifications, and local market conditions.
Salary by Experience Level
| Experience | Estimated Salary Range |
|---|---|
| 0-2 years (New Graduate) | $73,125 – $81,609 |
| 3-5 years (Mid Career) | $81,609 – $99,889 |
| 5+ years (Experienced) | $99,889 – $117,339 |
| 10+ years (Top Earner) | $117,339 – $129,902 |
PT salary ranges estimated from BLS percentile data. Individual physical therapist compensation varies by employer, certifications, and specialization.
Physical Therapist Job Market in Normal
Analyzing the local job market reveals that there are currently eight physical therapists employed in Normal, highlighting a competitive field despite a modest overall presence. With a cost of living index of 97.1, living expenses are lower than the national average, positioning the take-home purchasing power favorably for residents. Employers that typically pay the most for physical therapists in Normal include outpatient orthopedic clinics and hospital systems, which often offer performance-based bonuses tied to productivity metrics. The disparity in salaries can often be attributed to various factors, including workflow expectations, clinical specialization, and practice models (cash-pay vs. insurance). To maximize compensation, physical therapists should consider pursuing board certifications such as OCS or SCS, as well as exploring opportunities in high-demand settings like sports medicine or home health agencies. Understanding these dynamics is vital for professionals looking to enhance their physical therapist pay in Normal, IL.
More salary data for Normal, IL:
Frequently Asked Questions
How much do physical therapists make in Normal, IL in 2026?
Is Normal, IL a good place to work as a physical therapist?
Can physical therapists make $100K in Normal?
What is the cost-of-living adjusted physical therapist salary in Normal?
How much does a physical therapist make per hour in Normal?
Related Pages
Compare Salaries
Career Resources
Nearby Cities in Illinois
Written by Alex Morgan, DPT
Career Analyst
Alex Morgan has over 10 years of experience in physical therapy. They specialize in orthopedic rehabilitation. Alex works in a private practice setting.
Methodology & Data Source
Salary figures on this page are 2026 projections based on the Bureau of Labor Statistics Occupational Employment and Wage Statistics (OEWS) survey, May 2026 release. The BLS reported a median annual salary of $97,491 for physical therapistsin the Normal metropolitan area. A 2.46% compound annual growth rate (CAGR), calculated from 6-year national BLS wage trends, was applied to project current 2026 compensation. Percentile ranges (P10–P90) represent the full salary distribution across experience levels and practice settings in this market.
Data Sources & Methodology
Salary data for Normal is estimated from official BLS state-level occupational wage data (2025), adjusted for regional cost-of-living differences using BEA RPP (Regional Price Parities).
2026 figures are projected from 2025 BLS data using a compound annual growth rate (CAGR) of 2.46%, derived from historical BLS wage trends for physical therapists (SOC 29-1123).
Compiled and verified by Alex Morgan, DPT, a licensed physical therapist with 10+ years of clinical experience. · View source data at BLS.gov