Physical Therapist Salary in Quincy, IL: $99,981 (2026)
Quick Answer:A full-time physical therapist in Quincy, IL earns a median $99,981/year (≈ $48.06/hour) in nominal terms for 2026 — projected from BLS OEWS 2025 (SOC 29-1123). Once you factor in Quincy's price level (3% below national, BEA RPP 97.1), that paycheck buys what $102,967 would nationally. Nominal pay sits 3.0% below the Illinois state average.
Based on BLS state-level estimates · View source
In Quincy, IL, the projected median annual salary for physical therapists in 2026 is set at $99,981, reflecting the expectations of productivity and patient care that shape the compensation landscape. With a salary range from $73,702 at the 10th percentile to $130,218 at the 90th percentile, this figure indicates both the variability and potential in the local job market. These estimates are derived from BLS state-level data and regional price adjustments, illustrating how Quincy’s opportunities align with broader market trends. Given the substantial productivity expectations that dictate payments, therapists face the pressure of higher visit counts per day that ultimately impact effective hourly compensation.
About the Quincy Market
Salary estimated from Illinois average ($96,000) adjusted for local cost of living.
Salary Breakdown
| Percentile | Annual | Hourly |
|---|---|---|
| Entry Level (P10) | $73,702 | $35.43 |
| Lower Range (P25) | $85,511 | $41.11 |
| Median (P50)(typical) | $99,981 | $48.06 |
| Upper Range (P75) | $118,168 | $56.81 |
| Top Earners (P90) | $130,218 | $62.60 |
Median Salary Position
5.04% below the national average
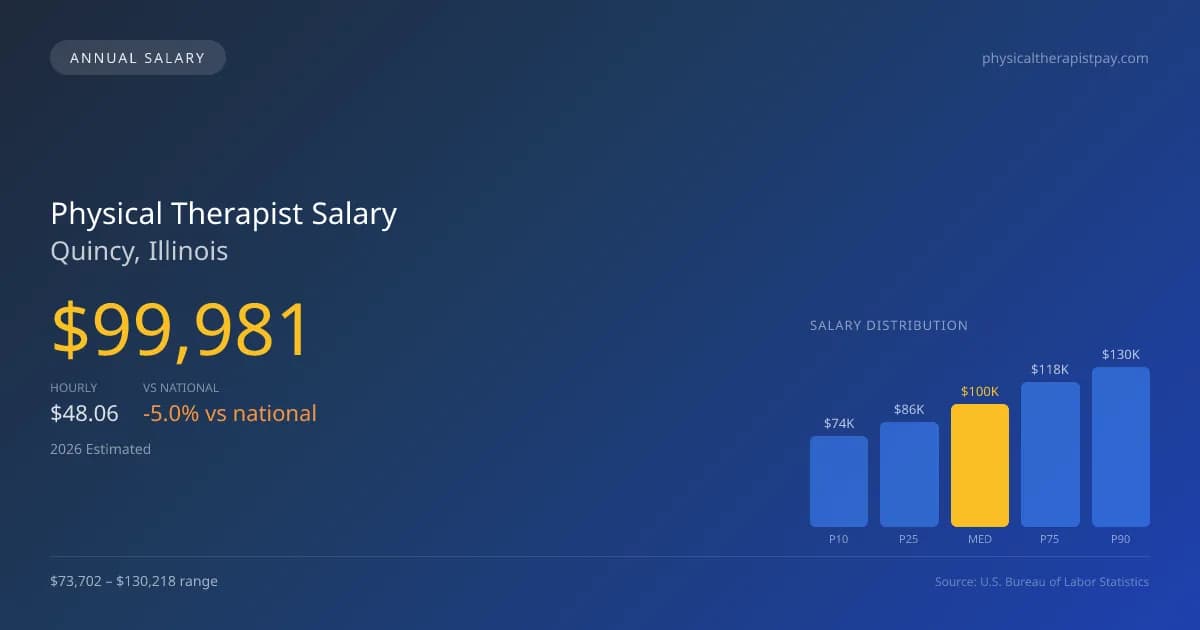
2026 Salary Percentile Distribution in Quincy
In Quincy, IL, the physical therapist salary spread from the 10th to 90th percentile is $56,516 (2026 est.). At $99,981, the local median is 5.04% below the national median of $105,288.
Salary Calculator
At 40 hours/week in Quincy: You'd be in the lower-middle range
How Quincy Physical Therapist Pay Compares
Quincy median: $99,981/year (2026)
| Compared To | Median Salary | Quincy Pays |
|---|---|---|
| Illinois Average | $103,074 | -3.00% less |
| National Average | $105,288 | -5.04% less |
Physical Therapists in Quincy, IL earn a median of $99,981 per year (2026 est.), which is 5.04% lower than the national median of $105,288 and 3.00% below the Illinois state average of $103,074.
Cost-of-Living Adjusted Salary
Quincy has a cost of living 2.90% below the national average, meaning your salary goes further here.
Adjusted salary = nominal × (100 / CoL index). CoL index: 100 = national average.
Quincy, IL has a cost-of-living index of 97.1 (below the national average of 100). A physical therapist earning $99,981 nominally has purchasing power equivalent to $102,967 in an average-cost city — an effective 2.99% boost.
Compare Purchasing Power
Select a city to see how your salary compares after cost of living
Select a city above to compare purchasing power
2019 BLS Actual
$84,932
2025 BLS Actual
$97,581
2026 Current Est.
$99,981
2019–2027 Growth
+20.6%
Salary Trajectory for Physical Therapists in Quincy (2019–2027)
2019–2025: actual BLS OEWS data for this metro area. 2026+: CAGR 2.46% projection.
| Year | Annual Salary | Status |
|---|---|---|
| 2019 | $84,932 | Actual |
| 2020 | $86,423 | Actual |
| 2021 | $90,801 | Actual |
| 2022 | $92,795 | Actual |
| 2023 | $94,685 | Actual |
| 2024 | $90,459 | Actual |
| 2025 | $97,581 | Actual |
| 2026(current) | $99,981 | Estimated |
| 2027 | $102,441 | Projected |
Based on 7 years of BLS OEWS data for the Quincy metropolitan area, the median physical therapist salary grew 14.9% from $84,932 (2019) to $97,581 (2025). At a 2.46% compound annual growth rate, salaries are projected to reach $102,441 by 2027 — a total increase of $17,509 (20.62%) from 2019.
Note: Historical values (2019–2025) are actual BLS OEWS figures for the Quincy metropolitan area, sourced from annual Occupational Employment and Wage Statistics surveys. 2026–2026 figures are current estimates, and 2027 values are projections, calculated using a 2.46% CAGR derived from 7-year BLS historical data. Actual salaries may vary based on employer, experience, certifications, and local market conditions.
Salary by Experience Level
| Experience | Estimated Salary Range |
|---|---|
| 0-2 years (New Graduate) | $73,702 – $85,511 |
| 3-5 years (Mid Career) | $85,511 – $99,981 |
| 5+ years (Experienced) | $99,981 – $118,168 |
| 10+ years (Top Earner) | $118,168 – $130,218 |
PT salary ranges estimated from BLS percentile data. Individual physical therapist compensation varies by employer, certifications, and specialization.
Physical Therapist Job Market in Quincy
In analyzing the local job market, it's noteworthy that only six physical therapists are presently employed in Quincy, which could suggest a niche demand within the community. The cost-of-living index sits at 97.1, slightly below the national average, meaning that take-home pay may stretch further here than in more expensive areas. Among employers, outpatient orthopedic clinics like Athletico and home health agencies appear to pay competitively, while factors such as board specialization certifications and clinic ownership can influence salary drastically. The disparity between lower and higher salaries can often be attributed to varying productivity expectations and reimbursement model choices, as therapists in cash-pay environments may command higher rates. For those seeking to maximize physical therapist pay in Quincy, standing out with additional certifications or pursuing roles in settings with higher patient volumes can be strategic moves in this evolving employment landscape.
More salary data for Quincy, IL:
Frequently Asked Questions
How much do physical therapists make in Quincy, IL in 2026?
Is Quincy, IL a good place to work as a physical therapist?
Can physical therapists make $100K in Quincy?
What is the cost-of-living adjusted physical therapist salary in Quincy?
How much does a physical therapist make per hour in Quincy?
Related Pages
Compare Salaries
Career Resources
Nearby Cities in Illinois
Written by Alex Morgan, DPT
Career Analyst
Alex Morgan has over 10 years of experience in physical therapy. They specialize in orthopedic rehabilitation. Alex works in a private practice setting.
Methodology & Data Source
Salary figures on this page are 2026 projections based on the Bureau of Labor Statistics Occupational Employment and Wage Statistics (OEWS) survey, May 2026 release. The BLS reported a median annual salary of $97,581 for physical therapistsin the Quincy metropolitan area. A 2.46% compound annual growth rate (CAGR), calculated from 6-year national BLS wage trends, was applied to project current 2026 compensation. Percentile ranges (P10–P90) represent the full salary distribution across experience levels and practice settings in this market.
Data Sources & Methodology
Salary data for Quincy is estimated from official BLS state-level occupational wage data (2025), adjusted for regional cost-of-living differences using BEA RPP (Regional Price Parities).
2026 figures are projected from 2025 BLS data using a compound annual growth rate (CAGR) of 2.46%, derived from historical BLS wage trends for physical therapists (SOC 29-1123).
Compiled and verified by Alex Morgan, DPT, a licensed physical therapist with 10+ years of clinical experience. · View source data at BLS.gov