Physical Therapist Salary in Michigan City, IN: $100,841 (2026)
Quick Answer:A full-time physical therapist in Michigan City, IN earns a median $100,841/year (≈ $48.48/hour) in nominal terms for 2026 — projected from BLS OEWS 2025 (SOC 29-1123). Once you factor in Michigan City's price level (8% below national, BEA RPP 91.7), that paycheck buys what $109,990 would nationally. Nominal pay sits 0.0% above the Indiana state average.
Official BLS data · View source
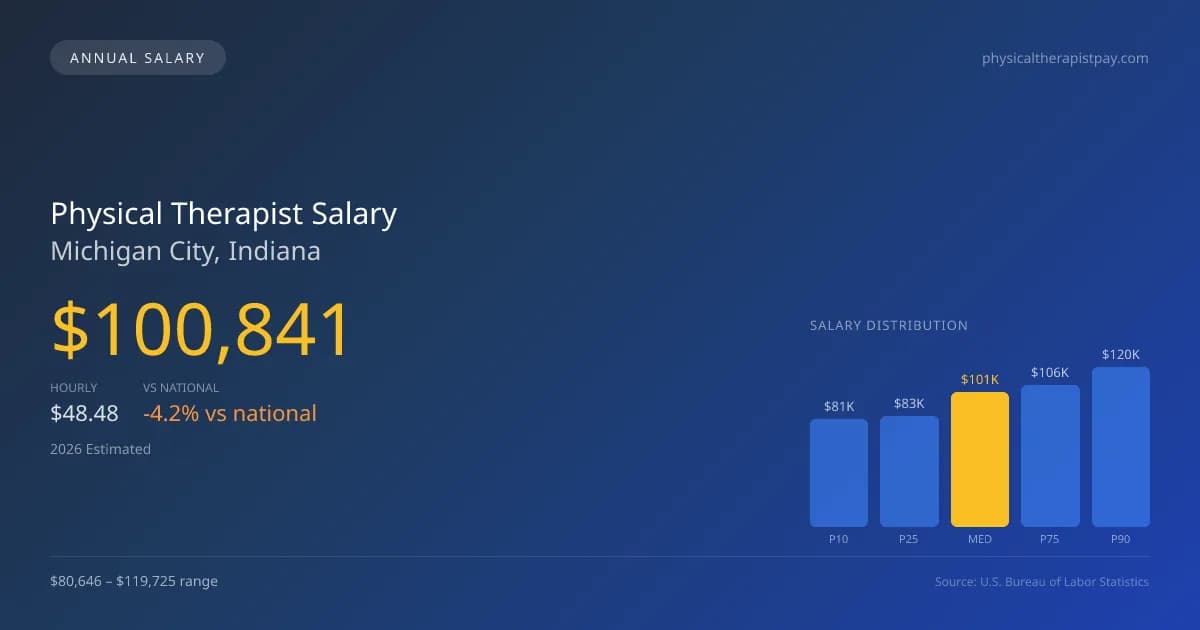
Physical therapists in Michigan City, Indiana, can expect to earn a median annual salary of $100,841, which is slightly below the national figure of $105,288 for 2026. Salary projections indicate a range from $80,646 at the lower end (P10) to $119,725 at the higher end (P90). These figures, derived from 2025 BLS OEWS data projected to 2026, reflect the competitive nature of the job market. Due to the predominance of outpatient orthopedic clinics alongside hospital settings, pay disparities exist as outpatient practices often emphasize productivity metrics, influencing overall compensation. The local environment also suggests a steady demand for physical therapists, making the market potential promising for those entering the field in Michigan City.
Salary Breakdown
| Percentile | Annual | Hourly |
|---|---|---|
| Entry Level (P10) | $80,646 | $38.77 |
| Lower Range (P25) | $83,239 | $40.02 |
| Median (P50)(typical) | $100,841 | $48.48 |
| Upper Range (P75) | $105,923 | $50.92 |
| Top Earners (P90) | $119,725 | $57.56 |
Median Salary Position
4.22% below the national average
2026 Salary Percentile Distribution in Michigan City
In Michigan City, IN, the physical therapist salary spread from the 10th to 90th percentile is $39,079 (2026 est.). At $100,841, the local median is 4.22% below the national median of $105,288.
Salary Calculator
At 40 hours/week in Michigan City: You'd be above the median
How Michigan City Physical Therapist Pay Compares
Michigan City median: $100,841/year (2026)
| Compared To | Median Salary | Michigan City Pays |
|---|---|---|
| National Average | $105,288 | -4.22% less |
Physical Therapists in Michigan City, IN earn a median of $100,841 per year (2026 est.), which is 4.22% lower than the national median of $105,288.
Cost-of-Living Adjusted Salary
Michigan City has a cost of living 8.32% below the national average, meaning your salary goes further here.
Adjusted salary = nominal × (100 / CoL index). CoL index: 100 = national average.
Michigan City, IN has a cost-of-living index of 91.682 (below the national average of 100). A physical therapist earning $100,841 nominally has purchasing power equivalent to $109,990 in an average-cost city — an effective 9.07% boost.
Compare Purchasing Power
Select a city to see how your salary compares after cost of living
Select a city above to compare purchasing power
2019 BLS Actual
$93,660
2025 BLS Actual
$98,420
2026 Current Est.
$100,841
2019–2027 Growth
+10.3%
Salary Trajectory for Physical Therapists in Michigan City (2019–2027)
2019–2025: actual BLS OEWS data for this metro area. 2026+: CAGR 2.46% projection.
| Year | Annual Salary | Status |
|---|---|---|
| 2019 | $93,660 | Actual |
| 2020 | $87,166 | Actual |
| 2021 | $91,582 | Actual |
| 2022 | $93,070 | Actual |
| 2023 | $95,499 | Actual |
| 2024 | $79,882 | Actual |
| 2025 | $98,420 | Actual |
| 2026(current) | $100,841 | Estimated |
| 2027 | $103,322 | Projected |
Based on 7 years of BLS OEWS data for the Michigan City metropolitan area, the median physical therapist salary grew 5.1% from $93,660 (2019) to $98,420 (2025). At a 2.46% compound annual growth rate, salaries are projected to reach $103,322 by 2027 — a total increase of $9,662 (10.32%) from 2019.
Note: Historical values (2019–2025) are actual BLS OEWS figures for the Michigan City metropolitan area, sourced from annual Occupational Employment and Wage Statistics surveys. 2026–2026 figures are current estimates, and 2027 values are projections, calculated using a 2.46% CAGR derived from 7-year BLS historical data. Actual salaries may vary based on employer, experience, certifications, and local market conditions.
Salary by Experience Level
| Experience | Estimated Salary Range |
|---|---|
| 0-2 years (New Graduate) | $80,646 – $83,239 |
| 3-5 years (Mid Career) | $83,239 – $100,841 |
| 5+ years (Experienced) | $100,841 – $105,923 |
| 10+ years (Top Earner) | $105,923 – $119,725 |
PT salary ranges estimated from BLS percentile data. Individual physical therapist compensation varies by employer, certifications, and specialization.
Physical Therapist Job Market in Michigan City
Within the job market, there are currently about 50 physical therapists employed in Michigan City, contributing to a robust local healthcare economy. The cost of living in the area is slightly below the national average, with a cost of living index of 91.682, which positively impacts take-home pay. Outpatient orthopedic chains like Athletico typically offer competitive salaries but may not match the compensation packages of hospital systems that provide more stability. The variation in physical therapist pay in Michigan City stems from numerous factors, including differing productivity expectations, opportunities for board certifications (such as OCS or SCS), and the choice between cash-pay models versus insurance practices. To maximize earning potential, physical therapists should consider gaining specialized certifications and exploring roles within high-demand settings like sports medicine or inpatient rehabilitation, factors which can significantly enhance their pay and career opportunities in Michigan City, IN.
More salary data for Michigan City, IN:
Frequently Asked Questions
How much do physical therapists make in Michigan City, IN in 2026?
Is Michigan City, IN a good place to work as a physical therapist?
Can physical therapists make $100K in Michigan City?
What is the cost-of-living adjusted physical therapist salary in Michigan City?
How much does a physical therapist make per hour in Michigan City?
Related Pages
Compare Salaries
Career Resources
Nearby Cities in Indiana
Written by Alex Morgan, DPT
Career Analyst
Alex Morgan has over 10 years of experience in physical therapy. They specialize in orthopedic rehabilitation. Alex works in a private practice setting.
Methodology & Data Source
Salary figures on this page are 2026 projections based on the Bureau of Labor Statistics Occupational Employment and Wage Statistics (OEWS) survey, May 2026 release. The BLS reported a median annual salary of $98,420 for physical therapistsin the Michigan City metropolitan area. A 2.46% compound annual growth rate (CAGR), calculated from 6-year national BLS wage trends, was applied to project current 2026 compensation. Percentile ranges (P10–P90) represent the full salary distribution across experience levels and practice settings in this market.
Data Sources & Methodology
Source: BLS, OEWS, 4-year dataset (–). Per-city data from annual BLS metropolitan area surveys.
2026 figures are projected from 2025 BLS data using a compound annual growth rate (CAGR) of 2.46%, derived from historical BLS wage trends for physical therapists (SOC 29-1123).
Compiled and verified by Alex Morgan, DPT, a licensed physical therapist with 10+ years of clinical experience. · View source data at BLS.gov