Physical Therapist Salary in Louisville, KY: $108,377 (2026)
Quick Answer:A full-time physical therapist in Louisville, KY earns a median $108,377/year (≈ $52.10/hour) in nominal terms for 2026 — projected from BLS OEWS 2025 (SOC 29-1123). Once you factor in Louisville's price level (11% below national, BEA RPP 89.3), that paycheck buys what $121,363 would nationally. Nominal pay sits 9.0% above the Kentucky state average.
Based on BLS state-level estimates · View source
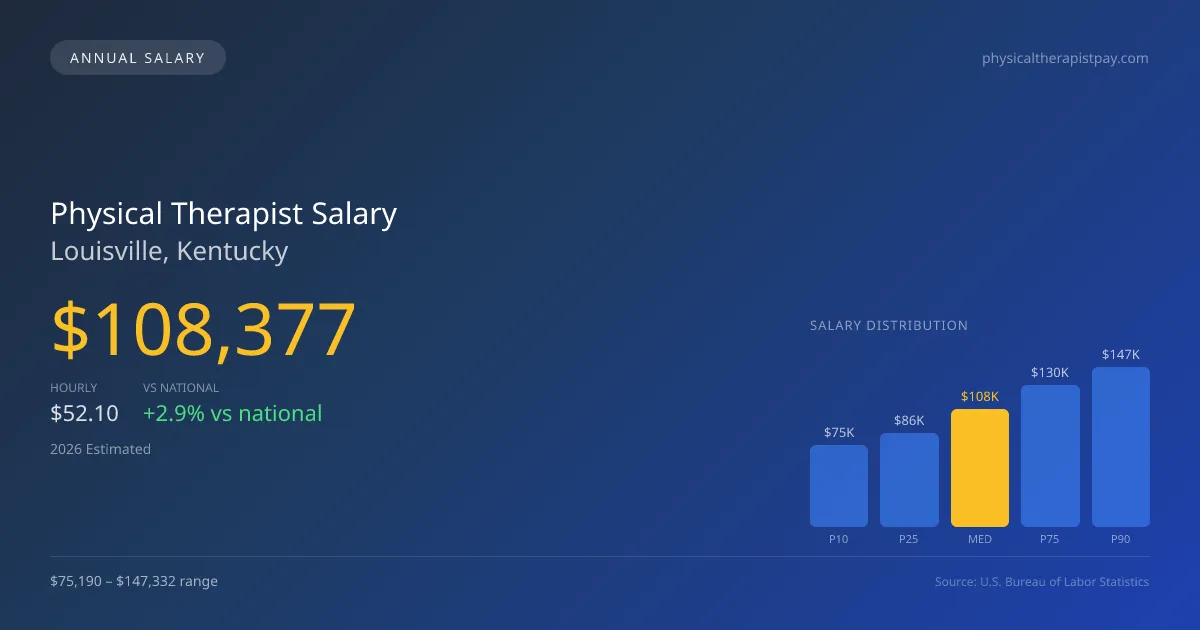
In 2026, physical therapists in Louisville, Kentucky, can expect to earn a median annual salary of $108,377, reflecting an increase over previous years and outperforming the national median of $105,288 by approximately 2.93%. The salary range for these professionals varies significantly, with entry-level positions starting around $75,190 and top earners reaching as much as $147,332. These figures are derived from estimates based on 2025 BLS data, adjusted for local economic conditions. The competitive nature of the Louisville job market, coupled with high productivity expectations, often results in aggressive compensation structures, particularly in practices that prioritize efficient patient visits.
About the Louisville Market
Salary estimated from Kentucky average ($92,000) adjusted for local cost of living.
Salary Breakdown
| Percentile | Annual | Hourly |
|---|---|---|
| Entry Level (P10) | $75,190 | $36.15 |
| Lower Range (P25) | $86,208 | $41.45 |
| Median (P50)(typical) | $108,377 | $52.10 |
| Upper Range (P75) | $130,325 | $62.65 |
| Top Earners (P90) | $147,332 | $70.83 |
Median Salary Position
2.93% above the national average
2026 Salary Percentile Distribution in Louisville
In Louisville, KY, the physical therapist salary spread from the 10th to 90th percentile is $72,142 (2026 est.). At $108,377, the local median is 2.93% above the national median of $105,288.
Salary Calculator
At 40 hours/week in Louisville: You'd be in the lower-middle range
How Louisville Physical Therapist Pay Compares
Louisville median: $108,377/year (2026)
| Compared To | Median Salary | Louisville Pays |
|---|---|---|
| Kentucky Average | $99,428 | +9.00% more |
| National Average | $105,288 | +2.93% more |
Physical Therapists in Louisville, KY earn a median of $108,377 per year (2026 est.), which is 2.93% higher than the national median of $105,288 and 9.00% above the Kentucky state average of $99,428.
Cost-of-Living Adjusted Salary
Louisville has a cost of living 10.70% below the national average, meaning your salary goes further here.
Adjusted salary = nominal × (100 / CoL index). CoL index: 100 = national average.
Louisville, KY has a cost-of-living index of 89.3 (below the national average of 100). A physical therapist earning $108,377 nominally has purchasing power equivalent to $121,363 in an average-cost city — an effective 11.98% boost.
Compare Purchasing Power
Select a city to see how your salary compares after cost of living
Select a city above to compare purchasing power
2019 BLS Actual
$92,064
2025 BLS Actual
$105,775
2026 Current Est.
$108,377
2019–2027 Growth
+20.6%
Salary Trajectory for Physical Therapists in Louisville (2019–2027)
2019–2025: actual BLS OEWS data for this metro area. 2026+: CAGR 2.46% projection.
| Year | Annual Salary | Status |
|---|---|---|
| 2019 | $92,064 | Actual |
| 2020 | $93,680 | Actual |
| 2021 | $98,426 | Actual |
| 2022 | $100,587 | Actual |
| 2023 | $102,636 | Actual |
| 2024 | $89,570 | Actual |
| 2025 | $105,775 | Actual |
| 2026(current) | $108,377 | Estimated |
| 2027 | $111,043 | Projected |
Based on 7 years of BLS OEWS data for the Louisville metropolitan area, the median physical therapist salary grew 14.9% from $92,064 (2019) to $105,775 (2025). At a 2.46% compound annual growth rate, salaries are projected to reach $111,043 by 2027 — a total increase of $18,979 (20.62%) from 2019.
Note: Historical values (2019–2025) are actual BLS OEWS figures for the Louisville metropolitan area, sourced from annual Occupational Employment and Wage Statistics surveys. 2026–2026 figures are current estimates, and 2027 values are projections, calculated using a 2.46% CAGR derived from 7-year BLS historical data. Actual salaries may vary based on employer, experience, certifications, and local market conditions.
Salary by Experience Level
| Experience | Estimated Salary Range |
|---|---|
| 0-2 years (New Graduate) | $75,190 – $86,208 |
| 3-5 years (Mid Career) | $86,208 – $108,377 |
| 5+ years (Experienced) | $108,377 – $130,325 |
| 10+ years (Top Earner) | $130,325 – $147,332 |
PT salary ranges estimated from BLS percentile data. Individual physical therapist compensation varies by employer, certifications, and specialization.
Physical Therapist Job Market in Louisville
Current employment in the area reveals a robust landscape with 132 physical therapists practicing in Louisville. The local cost of living index of 89.3 suggests that take-home pay retained by professionals offers greater purchasing power compared to many other regions in the U.S. Among various employers, outpatient orthopedic clinics such as ATI and Athletico often provide attractive pay structures alongside productivity bonuses, although hospital systems tend to offer higher base salaries typically linked to additional benefits. Factors such as board certifications (OCS or SCS) and clinic ownership can further enhance earnings, while cash-pay models may yield higher per-visit compensation. To maximize salary potential in the Louisville market, therapists should consider specializing, engaging in ongoing professional development, and negotiating contracts that reflect their expertise and productivity metrics.
More salary data for Louisville, KY:
Frequently Asked Questions
How much do physical therapists make in Louisville, KY in 2026?
Is Louisville, KY a good place to work as a physical therapist?
Can physical therapists make $100K in Louisville?
What is the cost-of-living adjusted physical therapist salary in Louisville?
How much does a physical therapist make per hour in Louisville?
Related Pages
Compare Salaries
Career Resources
Written by Alex Morgan, DPT
Career Analyst
Alex Morgan has over 10 years of experience in physical therapy. They specialize in orthopedic rehabilitation. Alex works in a private practice setting.
Methodology & Data Source
Salary figures on this page are 2026 projections based on the Bureau of Labor Statistics Occupational Employment and Wage Statistics (OEWS) survey, May 2026 release. The BLS reported a median annual salary of $105,775 for physical therapistsin the Louisville metropolitan area. A 2.46% compound annual growth rate (CAGR), calculated from 6-year national BLS wage trends, was applied to project current 2026 compensation. Percentile ranges (P10–P90) represent the full salary distribution across experience levels and practice settings in this market.
Data Sources & Methodology
Salary data for Louisville is estimated from official BLS state-level occupational wage data (2025), adjusted for regional cost-of-living differences using BEA RPP (Regional Price Parities).
2026 figures are projected from 2025 BLS data using a compound annual growth rate (CAGR) of 2.46%, derived from historical BLS wage trends for physical therapists (SOC 29-1123).
Compiled and verified by Alex Morgan, DPT, a licensed physical therapist with 10+ years of clinical experience. · View source data at BLS.gov