Physical Therapist Salary in Alexandria, LA: $105,923 (2026)
Quick Answer:A full-time physical therapist in Alexandria, LA earns a median $105,923/year (≈ $50.92/hour) in nominal terms for 2026 — projected from BLS OEWS 2025 (SOC 29-1123). Once you factor in Alexandria's price level (14% below national, BEA RPP 85.7), that paycheck buys what $123,618 would nationally. Nominal pay sits 4.5% above the Louisiana state average.
Official BLS data · View source
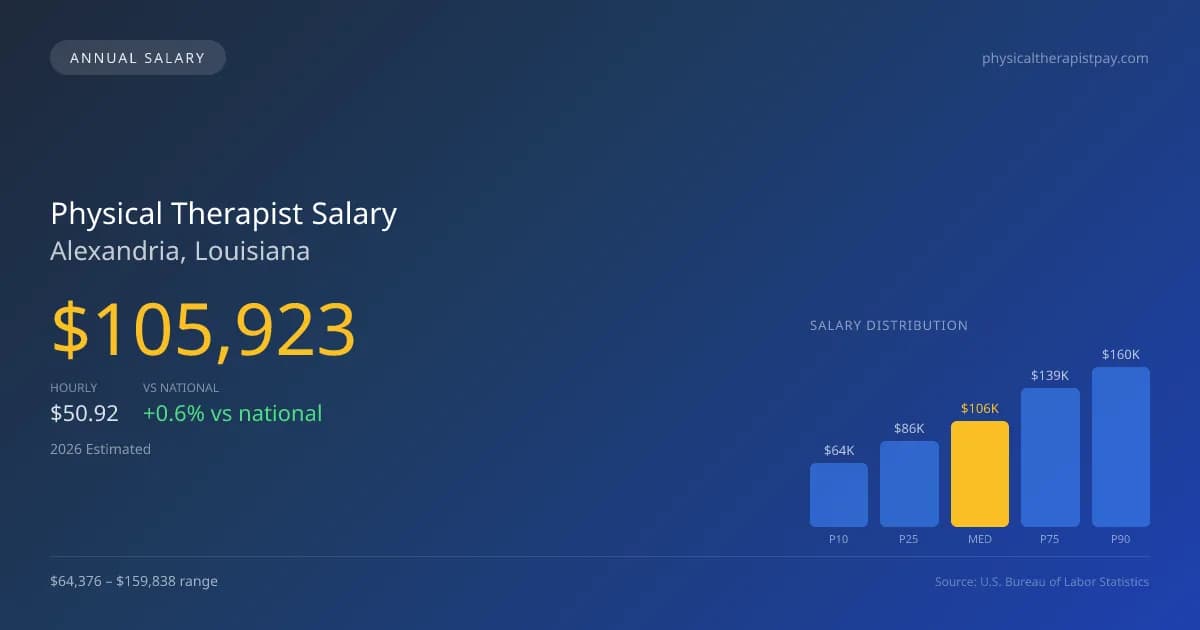
In 2026, physical therapists in Alexandria, Louisiana, can expect a median annual salary of $105,923, surpassing the national figure of $105,288 by a small margin. This competitive salary range varies significantly, with earnings falling anywhere between $64,376 at the lower end to as high as $159,838 for top earners. Derived from the official Bureau of Labor Statistics (BLS) OEWS data, these figures reflect the growing demand for specialized care, including cash-pay sports and orthopedic practices that are driving competitive compensation in the area. As the market evolves, Alexandria’s physical therapy professionals find themselves benefitting from both a well-compensated landscape and robust job opportunities given the local health needs.
Salary Breakdown
| Percentile | Annual | Hourly |
|---|---|---|
| Entry Level (P10) | $64,376 | $30.95 |
| Lower Range (P25) | $86,271 | $41.48 |
| Median (P50)(typical) | $105,923 | $50.92 |
| Upper Range (P75) | $139,079 | $66.87 |
| Top Earners (P90) | $159,838 | $76.84 |
Median Salary Position
0.60% above the national average
2026 Salary Percentile Distribution in Alexandria
In Alexandria, LA, the physical therapist salary spread from the 10th to 90th percentile is $95,462 (2026 est.). At $105,923, the local median is 0.6% above the national median of $105,288.
Salary Calculator
At 40 hours/week in Alexandria: You'd be in the lower-middle range
How Alexandria Physical Therapist Pay Compares
Alexandria median: $105,923/year (2026)
| Compared To | Median Salary | Alexandria Pays |
|---|---|---|
| Louisiana Average | $101,362 | +4.50% more |
| National Average | $105,288 | +0.60% more |
Physical Therapists in Alexandria, LA earn a median of $105,923 per year (2026 est.), which is 0.60% higher than the national median of $105,288 and 4.50% above the Louisiana state average of $101,362.
Cost-of-Living Adjusted Salary
Alexandria has a cost of living 14.31% below the national average, meaning your salary goes further here.
Adjusted salary = nominal × (100 / CoL index). CoL index: 100 = national average.
Alexandria, LA has a cost-of-living index of 85.686 (below the national average of 100). A physical therapist earning $105,923 nominally has purchasing power equivalent to $123,618 in an average-cost city — an effective 16.71% boost.
Compare Purchasing Power
Select a city to see how your salary compares after cost of living
Select a city above to compare purchasing power
2019 BLS Actual
$90,350
2025 BLS Actual
$103,380
2026 Current Est.
$105,923
2019–2027 Growth
+20.1%
Salary Trajectory for Physical Therapists in Alexandria (2019–2027)
2019–2025: actual BLS OEWS data for this metro area. 2026+: CAGR 2.46% projection.
| Year | Annual Salary | Status |
|---|---|---|
| 2019 | $90,350 | Actual |
| 2020 | $97,900 | Actual |
| 2021 | $97,810 | Actual |
| 2022 | $98,980 | Actual |
| 2023 | $97,170 | Actual |
| 2024 | $101,450 | Actual |
| 2025 | $103,380 | Actual |
| 2026(current) | $105,923 | Estimated |
| 2027 | $108,529 | Projected |
Based on 7 years of BLS OEWS data for the Alexandria metropolitan area, the median physical therapist salary grew 14.4% from $90,350 (2019) to $103,380 (2025). At a 2.46% compound annual growth rate, salaries are projected to reach $108,529 by 2027 — a total increase of $18,179 (20.12%) from 2019.
Note: Historical values (2019–2025) are actual BLS OEWS figures for the Alexandria metropolitan area, sourced from annual Occupational Employment and Wage Statistics surveys. 2026–2026 figures are current estimates, and 2027 values are projections, calculated using a 2.46% CAGR derived from 7-year BLS historical data. Actual salaries may vary based on employer, experience, certifications, and local market conditions.
Salary by Experience Level
| Experience | Estimated Salary Range |
|---|---|
| 0-2 years (New Graduate) | $64,376 – $86,271 |
| 3-5 years (Mid Career) | $86,271 – $105,923 |
| 5+ years (Experienced) | $105,923 – $139,079 |
| 10+ years (Top Earner) | $139,079 – $159,838 |
PT salary ranges estimated from BLS percentile data. Individual physical therapist compensation varies by employer, certifications, and specialization.
Physical Therapist Job Market in Alexandria
With 160 physical therapists currently employed in Alexandria, the local job market reflects a stable demand for qualified professionals in this sector. The cost of living index in Alexandria stands at 85.686, indicating a more affordable living situation, which enhances the take-home purchasing power for physical therapists compared to many other regions. Outpatient orthopedic clinics, both private practice and chains such as Athletico, tend to provide the most lucrative positions. Factors affecting the disparity in compensation include productivity expectations, certification stipends like OCS or SCS, and choices between cash-pay vs. insurance-based practices. To capitalize on the best pay opportunities in Alexandria, therapists should consider pursuing specialized certifications, improving productivity metrics such as patient visits per day, and exploring clinic ownership possibilities or travel physical therapy roles, which often offer higher compensation rates.
More salary data for Alexandria, LA:
Frequently Asked Questions
How much do physical therapists make in Alexandria, LA in 2026?
Is Alexandria, LA a good place to work as a physical therapist?
Can physical therapists make $100K in Alexandria?
What is the cost-of-living adjusted physical therapist salary in Alexandria?
How much does a physical therapist make per hour in Alexandria?
Related Pages
Compare Salaries
Career Resources
Nearby Cities in Louisiana
Written by Alex Morgan, DPT
Career Analyst
Alex Morgan has over 10 years of experience in physical therapy. They specialize in orthopedic rehabilitation. Alex works in a private practice setting.
Methodology & Data Source
Salary figures on this page are 2026 projections based on the Bureau of Labor Statistics Occupational Employment and Wage Statistics (OEWS) survey, May 2026 release. The BLS reported a median annual salary of $103,380 for physical therapistsin the Alexandria metropolitan area. A 2.46% compound annual growth rate (CAGR), calculated from 6-year national BLS wage trends, was applied to project current 2026 compensation. Percentile ranges (P10–P90) represent the full salary distribution across experience levels and practice settings in this market.
Data Sources & Methodology
Source: BLS, OEWS, 7-year dataset (–). Per-city data from annual BLS metropolitan area surveys.
2026 figures are projected from 2025 BLS data using a compound annual growth rate (CAGR) of 2.46%, derived from historical BLS wage trends for physical therapists (SOC 29-1123).
Compiled and verified by Alex Morgan, DPT, a licensed physical therapist with 10+ years of clinical experience. · View source data at BLS.gov