Physical Therapist Salary in Shreveport, LA: $102,696 (2026)
Quick Answer:A full-time physical therapist in Shreveport, LA earns a median $102,696/year (≈ $49.38/hour) in nominal terms for 2026 — projected from BLS OEWS 2025 (SOC 29-1123). Once you factor in Shreveport's price level (15% below national, BEA RPP 84.8), that paycheck buys what $121,152 would nationally. Nominal pay sits 1.3% above the Louisiana state average.
Official BLS data · View source
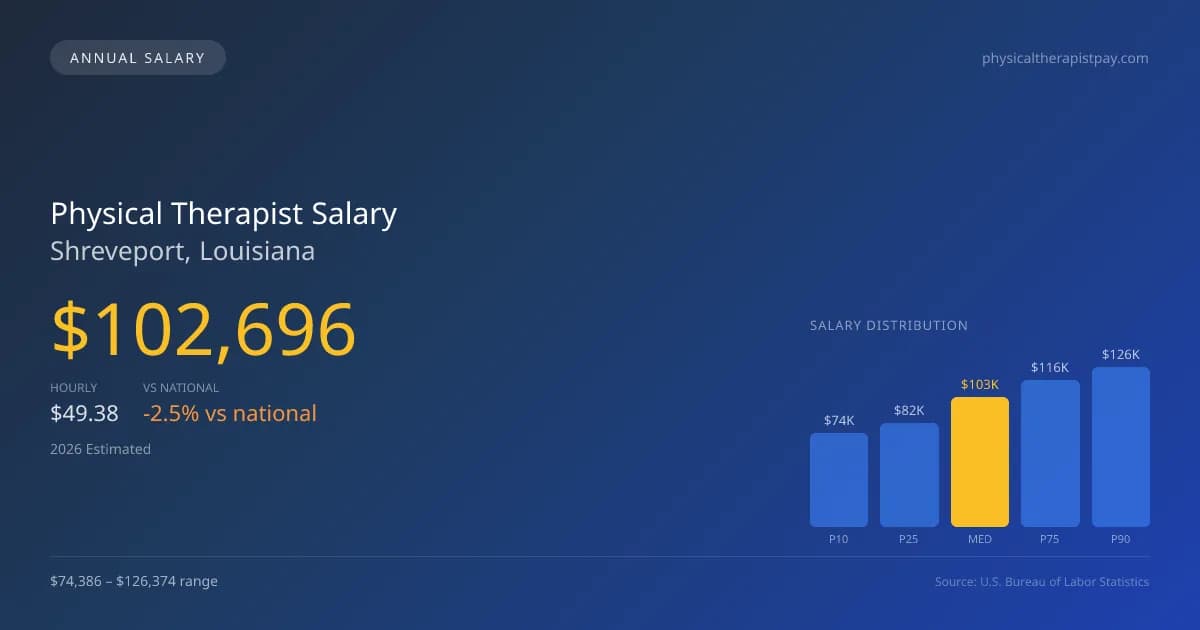
In Shreveport, Louisiana, the 2026 projected median annual salary for physical therapists is $102,696, slightly trailing the national median of $105,288. The salary range spans from $74,386 at the 10th percentile to $126,374 at the 90th percentile, reflecting a diverse compensation landscape influenced by demand and specialization. Recent trends in the physical therapy field, especially the rise of cash-pay sports and orthopedic specialists, have the potential to skew top-end salaries higher, particularly for those who can offer specialized care or advanced certifications. This data, derived from 2025 BLS OEWS surveys and projected to 2026, highlights a competitive market for skilled professionals looking to capitalize on emerging opportunities in Shreveport.
Salary Breakdown
| Percentile | Annual | Hourly |
|---|---|---|
| Entry Level (P10) | $74,386 | $35.76 |
| Lower Range (P25) | $82,480 | $39.65 |
| Median (P50)(typical) | $102,696 | $49.38 |
| Upper Range (P75) | $116,425 | $55.97 |
| Top Earners (P90) | $126,374 | $60.76 |
Median Salary Position
2.46% below the national average
2026 Salary Percentile Distribution in Shreveport
In Shreveport, LA, the physical therapist salary spread from the 10th to 90th percentile is $51,988 (2026 est.). At $102,696, the local median is 2.46% below the national median of $105,288.
Salary Calculator
At 40 hours/week in Shreveport: You'd be above the median
How Shreveport Physical Therapist Pay Compares
Shreveport median: $102,696/year (2026)
| Compared To | Median Salary | Shreveport Pays |
|---|---|---|
| Louisiana Average | $101,378 | +1.30% more |
| National Average | $105,288 | -2.46% less |
Physical Therapists in Shreveport, LA earn a median of $102,696 per year (2026 est.), which is 2.46% lower than the national median of $105,288 and 1.30% above the Louisiana state average of $101,378.
Cost-of-Living Adjusted Salary
Shreveport has a cost of living 15.23% below the national average, meaning your salary goes further here.
Adjusted salary = nominal × (100 / CoL index). CoL index: 100 = national average.
Shreveport, LA has a cost-of-living index of 84.766 (below the national average of 100). A physical therapist earning $102,696 nominally has purchasing power equivalent to $121,152 in an average-cost city — an effective 17.97% boost.
Compare Purchasing Power
Select a city to see how your salary compares after cost of living
Select a city above to compare purchasing power
2019 BLS Actual
$91,380
2025 BLS Actual
$100,230
2026 Current Est.
$102,696
2019–2027 Growth
+15.1%
Salary Trajectory for Physical Therapists in Shreveport (2019–2027)
2019–2025: actual BLS OEWS data for this metro area. 2026+: CAGR 2.46% projection.
| Year | Annual Salary | Status |
|---|---|---|
| 2019 | $91,380 | Actual |
| 2020 | $96,730 | Actual |
| 2021 | $97,160 | Actual |
| 2022 | $100,190 | Actual |
| 2023 | $104,110 | Actual |
| 2024 | $105,110 | Actual |
| 2025 | $100,230 | Actual |
| 2026(current) | $102,696 | Estimated |
| 2027 | $105,222 | Projected |
Based on 7 years of BLS OEWS data for the Shreveport metropolitan area, the median physical therapist salary grew 9.7% from $91,380 (2019) to $100,230 (2025). At a 2.46% compound annual growth rate, salaries are projected to reach $105,222 by 2027 — a total increase of $13,842 (15.15%) from 2019.
Note: Historical values (2019–2025) are actual BLS OEWS figures for the Shreveport metropolitan area, sourced from annual Occupational Employment and Wage Statistics surveys. 2026–2026 figures are current estimates, and 2027 values are projections, calculated using a 2.46% CAGR derived from 7-year BLS historical data. Actual salaries may vary based on employer, experience, certifications, and local market conditions.
Salary by Experience Level
| Experience | Estimated Salary Range |
|---|---|
| 0-2 years (New Graduate) | $74,386 – $82,480 |
| 3-5 years (Mid Career) | $82,480 – $102,696 |
| 5+ years (Experienced) | $102,696 – $116,425 |
| 10+ years (Top Earner) | $116,425 – $126,374 |
PT salary ranges estimated from BLS percentile data. Individual physical therapist compensation varies by employer, certifications, and specialization.
Physical Therapist Job Market in Shreveport
The job market in Shreveport features approximately 280 employed physical therapists, contributing to a steady demand for services amidst a lower-than-average cost of living index of 84.766. This financial context can enhance take-home pay, enabling practitioners to stretch their earnings further. Among local employers, outpatient orthopedic clinics, including private practices and well-known chains like ATI and Athletico, tend to offer appealing compensation packages, often supplemented by productivity bonuses. Factors influencing the pay spread include productivity expectations, board certifications such as OCS or SCS that can command additional stipends, and the growing preference for cash-pay models over traditional insurance practices. To maximize earnings in this market, physical therapists might consider strategies such as pursuing additional certifications, gaining experience in high-demand specializations, and exploring opportunities in travel therapy, which often commands premium rates compared to traditional settings.
More salary data for Shreveport, LA:
Frequently Asked Questions
How much do physical therapists make in Shreveport, LA in 2026?
Is Shreveport, LA a good place to work as a physical therapist?
Can physical therapists make $100K in Shreveport?
What is the cost-of-living adjusted physical therapist salary in Shreveport?
How much does a physical therapist make per hour in Shreveport?
Related Pages
Compare Salaries
Career Resources
Nearby Cities in Louisiana
Written by Alex Morgan, DPT
Career Analyst
Alex Morgan has over 10 years of experience in physical therapy. They specialize in orthopedic rehabilitation. Alex works in a private practice setting.
Methodology & Data Source
Salary figures on this page are 2026 projections based on the Bureau of Labor Statistics Occupational Employment and Wage Statistics (OEWS) survey, May 2026 release. The BLS reported a median annual salary of $100,230 for physical therapistsin the Shreveport metropolitan area. A 2.46% compound annual growth rate (CAGR), calculated from 6-year national BLS wage trends, was applied to project current 2026 compensation. Percentile ranges (P10–P90) represent the full salary distribution across experience levels and practice settings in this market.
Data Sources & Methodology
Source: BLS, OEWS, 7-year dataset (–). Per-city data from annual BLS metropolitan area surveys.
2026 figures are projected from 2025 BLS data using a compound annual growth rate (CAGR) of 2.46%, derived from historical BLS wage trends for physical therapists (SOC 29-1123).
Compiled and verified by Alex Morgan, DPT, a licensed physical therapist with 10+ years of clinical experience. · View source data at BLS.gov