Physical Therapist Salary in Hagerstown, MD: $103,095 (2026)
Quick Answer:A full-time physical therapist in Hagerstown, MD earns a median $103,095/year (≈ $49.57/hour) in nominal terms for 2026 — projected from BLS OEWS 2025 (SOC 29-1123). Once you factor in Hagerstown's price level (6% below national, BEA RPP 94.2), that paycheck buys what $109,476 would nationally. Nominal pay sits 10.4% below the Maryland state average.
Official BLS data · View source
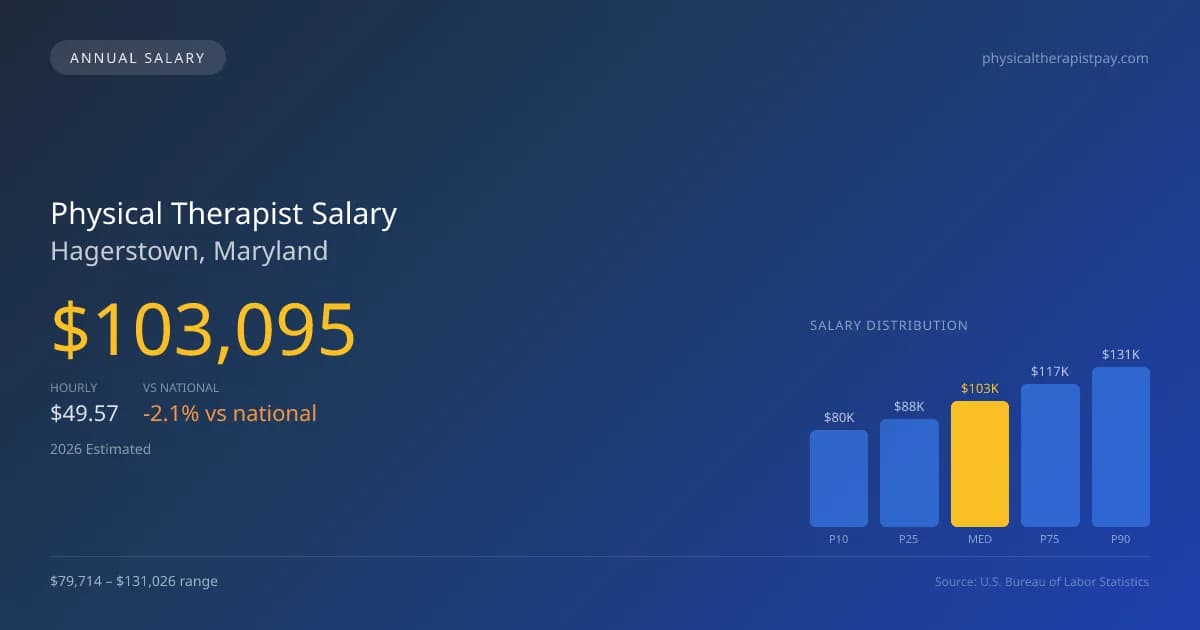
In 2026, physical therapist salaries in Hagerstown, Maryland are projected to reach a median annual figure of $103,095, reflecting a competitive market for this essential healthcare profession. The pay scale spans from $79,714 at the lower end to $131,026 among the highest earners. Data drawn from 2025 BLS OEWS surveys reveals that this compensation is slightly below the national median salary of $105,288, indicating nuanced local dynamics likely influenced by the prevalence of outpatient chains versus hospital settings. Physical therapists working in these various environments may find their salaries differ significantly based on employer type and patient volume, shaping the overall economic landscape of rehabilitation services in Hagerstown.
Salary Breakdown
| Percentile | Annual | Hourly |
|---|---|---|
| Entry Level (P10) | $79,714 | $38.32 |
| Lower Range (P25) | $88,064 | $42.34 |
| Median (P50)(typical) | $103,095 | $49.57 |
| Upper Range (P75) | $117,214 | $56.35 |
| Top Earners (P90) | $131,026 | $62.99 |
Median Salary Position
2.08% below the national average
2026 Salary Percentile Distribution in Hagerstown
In Hagerstown, MD, the physical therapist salary spread from the 10th to 90th percentile is $51,312 (2026 est.). At $103,095, the local median is 2.08% below the national median of $105,288.
Salary Calculator
At 40 hours/week in Hagerstown: You'd be in the lower-middle range
How Hagerstown Physical Therapist Pay Compares
Hagerstown median: $103,095/year (2026)
| Compared To | Median Salary | Hagerstown Pays |
|---|---|---|
| Maryland Average | $115,062 | -10.40% less |
| National Average | $105,288 | -2.08% less |
Physical Therapists in Hagerstown, MD earn a median of $103,095 per year (2026 est.), which is 2.08% lower than the national median of $105,288 and 10.40% below the Maryland state average of $115,062.
Cost-of-Living Adjusted Salary
Hagerstown has a cost of living 5.83% below the national average, meaning your salary goes further here.
Adjusted salary = nominal × (100 / CoL index). CoL index: 100 = national average.
Hagerstown, MD has a cost-of-living index of 94.171 (below the national average of 100). A physical therapist earning $103,095 nominally has purchasing power equivalent to $109,476 in an average-cost city — an effective 6.19% boost.
Compare Purchasing Power
Select a city to see how your salary compares after cost of living
Select a city above to compare purchasing power
2019 BLS Actual
$78,200
2025 BLS Actual
$100,620
2026 Current Est.
$103,095
2019–2027 Growth
+35.1%
Salary Trajectory for Physical Therapists in Hagerstown (2019–2027)
2019–2025: actual BLS OEWS data for this metro area. 2026+: CAGR 2.46% projection.
| Year | Annual Salary | Status |
|---|---|---|
| 2019 | $78,200 | Actual |
| 2020 | $83,080 | Actual |
| 2021 | $82,200 | Actual |
| 2022 | $86,730 | Actual |
| 2023 | $99,160 | Actual |
| 2024 | $101,380 | Actual |
| 2025 | $100,620 | Actual |
| 2026(current) | $103,095 | Estimated |
| 2027 | $105,631 | Projected |
Based on 7 years of BLS OEWS data for the Hagerstown metropolitan area, the median physical therapist salary grew 28.7% from $78,200 (2019) to $100,620 (2025). At a 2.46% compound annual growth rate, salaries are projected to reach $105,631 by 2027 — a total increase of $27,431 (35.08%) from 2019.
Note: Historical values (2019–2025) are actual BLS OEWS figures for the Hagerstown metropolitan area, sourced from annual Occupational Employment and Wage Statistics surveys. 2026–2026 figures are current estimates, and 2027 values are projections, calculated using a 2.46% CAGR derived from 7-year BLS historical data. Actual salaries may vary based on employer, experience, certifications, and local market conditions.
Salary by Experience Level
| Experience | Estimated Salary Range |
|---|---|
| 0-2 years (New Graduate) | $79,714 – $88,064 |
| 3-5 years (Mid Career) | $88,064 – $103,095 |
| 5+ years (Experienced) | $103,095 – $117,214 |
| 10+ years (Top Earner) | $117,214 – $131,026 |
PT salary ranges estimated from BLS percentile data. Individual physical therapist compensation varies by employer, certifications, and specialization.
Physical Therapist Job Market in Hagerstown
The local job market currently employs about 180 physical therapists, a promising indicator of stability and potential growth in the region. With a cost-of-living index of 94.171, Hagerstown provides a relatively affordable backdrop, allowing for greater purchasing power compared to many other areas. Employers that tend to offer higher compensation in Hagerstown include outpatient orthopedic clinics, particularly larger chains that often employ productivity-based incentives. Factors such as board certifications (OCS and SCS) can also influence earnings, as they may come with stipends or higher reimbursement rates. Physical therapists aiming to maximize their pay in Hagerstown should consider negotiating for equity in private practices or exploring cash-pay models, which can sometimes sidestep restrictive insurance compensation and lead to more favorable income outcomes.
More salary data for Hagerstown, MD:
Frequently Asked Questions
How much do physical therapists make in Hagerstown, MD in 2026?
Is Hagerstown, MD a good place to work as a physical therapist?
Can physical therapists make $100K in Hagerstown?
What is the cost-of-living adjusted physical therapist salary in Hagerstown?
How much does a physical therapist make per hour in Hagerstown?
Related Pages
Compare Salaries
Career Resources
Nearby Cities in Maryland
Written by Alex Morgan, DPT
Career Analyst
Alex Morgan has over 10 years of experience in physical therapy. They specialize in orthopedic rehabilitation. Alex works in a private practice setting.
Methodology & Data Source
Salary figures on this page are 2026 projections based on the Bureau of Labor Statistics Occupational Employment and Wage Statistics (OEWS) survey, May 2026 release. The BLS reported a median annual salary of $100,620 for physical therapistsin the Hagerstown metropolitan area. A 2.46% compound annual growth rate (CAGR), calculated from 6-year national BLS wage trends, was applied to project current 2026 compensation. Percentile ranges (P10–P90) represent the full salary distribution across experience levels and practice settings in this market.
Data Sources & Methodology
Source: BLS, OEWS, 7-year dataset (–). Per-city data from annual BLS metropolitan area surveys.
2026 figures are projected from 2025 BLS data using a compound annual growth rate (CAGR) of 2.46%, derived from historical BLS wage trends for physical therapists (SOC 29-1123).
Compiled and verified by Alex Morgan, DPT, a licensed physical therapist with 10+ years of clinical experience. · View source data at BLS.gov