Physical Therapist Salary in Haverhill, MA: $107,672 (2026)
Quick Answer:A full-time physical therapist in Haverhill, MA earns a median $107,672/year (≈ $51.76/hour) in nominal terms for 2026 — projected from BLS OEWS 2025 (SOC 29-1123). Once you factor in Haverhill's price level (9% above national, BEA RPP 108.5), that paycheck buys what $99,237 would nationally. Nominal pay sits 0.3% above the Massachusetts state average.
Based on BLS state-level estimates · View source
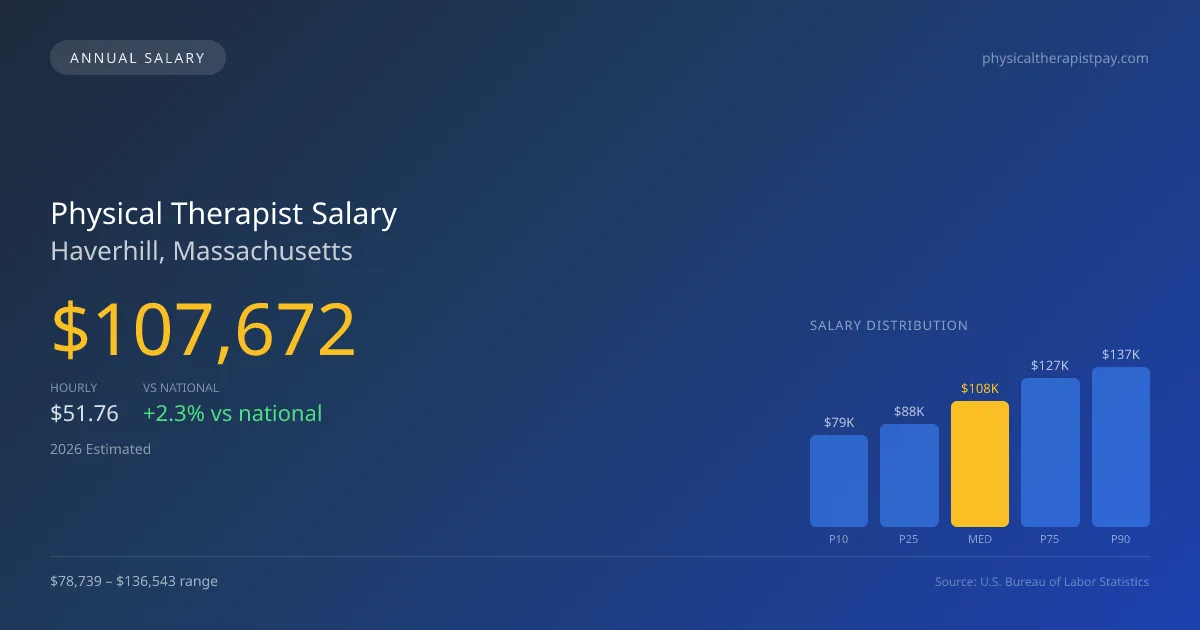
In 2026, physical therapist salaries in Haverhill, Massachusetts, are projected to reach a median annual figure of $107,672, slightly above the national median of $105,288. The salary range spans from $78,739 at the 10th percentile to $136,543 at the 90th percentile, reflecting a market with diverse compensation opportunities driven by productivity and reporting standards. These estimates, derived from 2025 BLS data and adjusted for regional price parities, highlight Haverhill's standing as a competitive area for physical therapy professionals. As demand grows, the ability to balance patient visits and effective treatment is becoming increasingly critical in shaping compensation levels.
About the Haverhill Market
Salary estimated from Massachusetts average ($100,000) adjusted for local cost of living.
Salary Breakdown
| Percentile | Annual | Hourly |
|---|---|---|
| Entry Level (P10) | $78,739 | $37.86 |
| Lower Range (P25) | $88,238 | $42.42 |
| Median (P50)(typical) | $107,672 | $51.76 |
| Upper Range (P75) | $126,750 | $60.93 |
| Top Earners (P90) | $136,543 | $65.65 |
Median Salary Position
2.26% above the national average
2026 Salary Percentile Distribution in Haverhill
In Haverhill, MA, the physical therapist salary spread from the 10th to 90th percentile is $57,804 (2026 est.). At $107,672, the local median is 2.26% above the national median of $105,288.
Salary Calculator
At 40 hours/week in Haverhill: You'd be above the median
How Haverhill Physical Therapist Pay Compares
Haverhill median: $107,672/year (2026)
| Compared To | Median Salary | Haverhill Pays |
|---|---|---|
| Massachusetts Average | $107,350 | +0.30% more |
| National Average | $105,288 | +2.26% more |
Physical Therapists in Haverhill, MA earn a median of $107,672 per year (2026 est.), which is 2.26% higher than the national median of $105,288 and 0.30% above the Massachusetts state average of $107,350.
Cost-of-Living Adjusted Salary
Haverhill has a cost of living 8.50% above the national average.
Adjusted salary = nominal × (100 / CoL index). CoL index: 100 = national average.
Haverhill, MA has a cost-of-living index of 108.5 (above the national average of 100). While the nominal salary of $107,672 is competitive, the higher cost of living reduces purchasing power to an effective $99,237 — a 7.83% reduction.
Compare Purchasing Power
Select a city to see how your salary compares after cost of living
Select a city above to compare purchasing power
2019 BLS Actual
$91,465
2025 BLS Actual
$105,087
2026 Current Est.
$107,672
2019–2027 Growth
+20.6%
Salary Trajectory for Physical Therapists in Haverhill (2019–2027)
2019–2025: actual BLS OEWS data for this metro area. 2026+: CAGR 2.46% projection.
| Year | Annual Salary | Status |
|---|---|---|
| 2019 | $91,465 | Actual |
| 2020 | $93,071 | Actual |
| 2021 | $97,785 | Actual |
| 2022 | $99,933 | Actual |
| 2023 | $101,968 | Actual |
| 2024 | $108,829 | Actual |
| 2025 | $105,087 | Actual |
| 2026(current) | $107,672 | Estimated |
| 2027 | $110,321 | Projected |
Based on 7 years of BLS OEWS data for the Haverhill metropolitan area, the median physical therapist salary grew 14.9% from $91,465 (2019) to $105,087 (2025). At a 2.46% compound annual growth rate, salaries are projected to reach $110,321 by 2027 — a total increase of $18,856 (20.62%) from 2019.
Note: Historical values (2019–2025) are actual BLS OEWS figures for the Haverhill metropolitan area, sourced from annual Occupational Employment and Wage Statistics surveys. 2026–2026 figures are current estimates, and 2027 values are projections, calculated using a 2.46% CAGR derived from 7-year BLS historical data. Actual salaries may vary based on employer, experience, certifications, and local market conditions.
Salary by Experience Level
| Experience | Estimated Salary Range |
|---|---|
| 0-2 years (New Graduate) | $78,739 – $88,238 |
| 3-5 years (Mid Career) | $88,238 – $107,672 |
| 5+ years (Experienced) | $107,672 – $126,750 |
| 10+ years (Top Earner) | $126,750 – $136,543 |
PT salary ranges estimated from BLS percentile data. Individual physical therapist compensation varies by employer, certifications, and specialization.
Physical Therapist Job Market in Haverhill
Looking deeper into the job market in Haverhill, MA, there are currently 16 physical therapists employed locally, highlighting a niche but potentially growing field. The cost of living index in the area stands at 108.5, which presents considerations for the purchasing power of salaries. Outpatient orthopedic clinics, particularly chains like Athletico and ATI, tend to offer salaries towards the lower end of the spectrum, whereas hospital inpatient rehab and specialized facilities may provide better compensation packages. The variation in pay points to the impacts of productivity expectations, board certifications like OCS and SCS, and practice models that include cash-pay options versus insurance reimbursement. To maximize pay in Haverhill, professionals should focus on enhancing their productivity metrics, obtaining specialized certifications, and understanding the local market's nuances.
More salary data for Haverhill, MA:
Frequently Asked Questions
How much do physical therapists make in Haverhill, MA in 2026?
Is Haverhill, MA a good place to work as a physical therapist?
Can physical therapists make $100K in Haverhill?
What is the cost-of-living adjusted physical therapist salary in Haverhill?
How much does a physical therapist make per hour in Haverhill?
Related Pages
Compare Salaries
Career Resources
Nearby Cities in Massachusetts
Written by Alex Morgan, DPT
Career Analyst
Alex Morgan has over 10 years of experience in physical therapy. They specialize in orthopedic rehabilitation. Alex works in a private practice setting.
Methodology & Data Source
Salary figures on this page are 2026 projections based on the Bureau of Labor Statistics Occupational Employment and Wage Statistics (OEWS) survey, May 2026 release. The BLS reported a median annual salary of $105,087 for physical therapistsin the Haverhill metropolitan area. A 2.46% compound annual growth rate (CAGR), calculated from 6-year national BLS wage trends, was applied to project current 2026 compensation. Percentile ranges (P10–P90) represent the full salary distribution across experience levels and practice settings in this market.
Data Sources & Methodology
Salary data for Haverhill is estimated from official BLS state-level occupational wage data (2025), adjusted for regional cost-of-living differences using BEA RPP (Regional Price Parities).
2026 figures are projected from 2025 BLS data using a compound annual growth rate (CAGR) of 2.46%, derived from historical BLS wage trends for physical therapists (SOC 29-1123).
Compiled and verified by Alex Morgan, DPT, a licensed physical therapist with 10+ years of clinical experience. · View source data at BLS.gov