Physical Therapist Salary in Needham, MA: $105,472 (2026)
Quick Answer:A full-time physical therapist in Needham, MA earns a median $105,472/year (≈ $50.71/hour) in nominal terms for 2026 — projected from BLS OEWS 2025 (SOC 29-1123). Once you factor in Needham's price level (9% above national, BEA RPP 108.5), that paycheck buys what $97,209 would nationally. Nominal pay sits 1.7% below the Massachusetts state average.
Based on BLS state-level estimates · View source
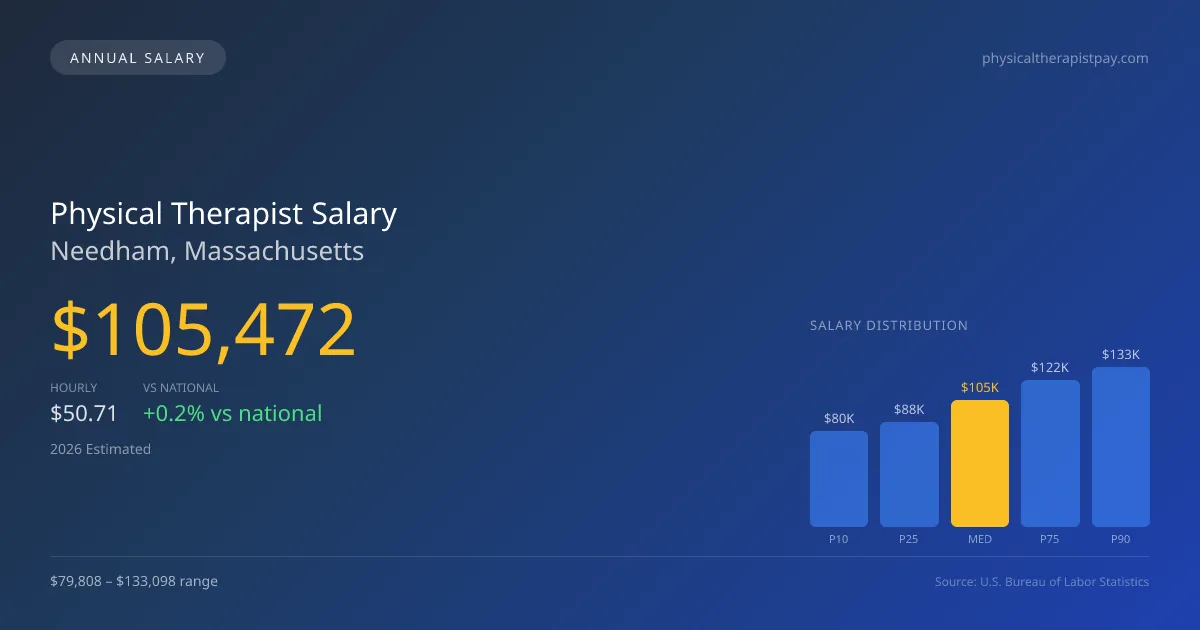
In 2026, physical therapists in Needham, Massachusetts, can expect a median annual salary of $105,472, slightly above the national median of $105,288. The local salary range spans from $79,808 at the 10th percentile to a robust $133,098 at the 90th percentile, reflecting the high demand for specialized care, particularly in cash-pay sports and orthopedic settings. This trend has influenced the upper tiers of compensation, as many clinics now prioritize tailored services that often result in better financial outcomes for providers. These estimates derive from BLS state-level data and incorporate regional price parity adjustments, which are particularly relevant in Needham's economy.
About the Needham Market
Salary estimated from Massachusetts average ($100,000) adjusted for local cost of living.
Salary Breakdown
| Percentile | Annual | Hourly |
|---|---|---|
| Entry Level (P10) | $79,808 | $38.37 |
| Lower Range (P25) | $87,730 | $42.18 |
| Median (P50)(typical) | $105,472 | $50.71 |
| Upper Range (P75) | $122,294 | $58.79 |
| Top Earners (P90) | $133,098 | $63.99 |
Median Salary Position
0.17% above the national average
2026 Salary Percentile Distribution in Needham
In Needham, MA, the physical therapist salary spread from the 10th to 90th percentile is $53,290 (2026 est.). At $105,472, the local median is 0.17% above the national median of $105,288.
Salary Calculator
At 40 hours/week in Needham: You'd be in the lower-middle range
How Needham Physical Therapist Pay Compares
Needham median: $105,472/year (2026)
| Compared To | Median Salary | Needham Pays |
|---|---|---|
| Massachusetts Average | $107,296 | -1.70% less |
| National Average | $105,288 | +0.17% more |
Physical Therapists in Needham, MA earn a median of $105,472 per year (2026 est.), which is 0.17% higher than the national median of $105,288 and 1.70% below the Massachusetts state average of $107,296.
Cost-of-Living Adjusted Salary
Needham has a cost of living 8.50% above the national average.
Adjusted salary = nominal × (100 / CoL index). CoL index: 100 = national average.
Needham, MA has a cost-of-living index of 108.5 (above the national average of 100). While the nominal salary of $105,472 is competitive, the higher cost of living reduces purchasing power to an effective $97,209 — a 7.83% reduction.
Compare Purchasing Power
Select a city to see how your salary compares after cost of living
Select a city above to compare purchasing power
2019 BLS Actual
$89,597
2025 BLS Actual
$102,940
2026 Current Est.
$105,472
2019–2027 Growth
+20.6%
Salary Trajectory for Physical Therapists in Needham (2019–2027)
2019–2025: actual BLS OEWS data for this metro area. 2026+: CAGR 2.46% projection.
| Year | Annual Salary | Status |
|---|---|---|
| 2019 | $89,597 | Actual |
| 2020 | $91,169 | Actual |
| 2021 | $95,787 | Actual |
| 2022 | $97,891 | Actual |
| 2023 | $99,885 | Actual |
| 2024 | $106,605 | Actual |
| 2025 | $102,940 | Actual |
| 2026(current) | $105,472 | Estimated |
| 2027 | $108,067 | Projected |
Based on 7 years of BLS OEWS data for the Needham metropolitan area, the median physical therapist salary grew 14.9% from $89,597 (2019) to $102,940 (2025). At a 2.46% compound annual growth rate, salaries are projected to reach $108,067 by 2027 — a total increase of $18,470 (20.61%) from 2019.
Note: Historical values (2019–2025) are actual BLS OEWS figures for the Needham metropolitan area, sourced from annual Occupational Employment and Wage Statistics surveys. 2026–2026 figures are current estimates, and 2027 values are projections, calculated using a 2.46% CAGR derived from 7-year BLS historical data. Actual salaries may vary based on employer, experience, certifications, and local market conditions.
Salary by Experience Level
| Experience | Estimated Salary Range |
|---|---|
| 0-2 years (New Graduate) | $79,808 – $87,730 |
| 3-5 years (Mid Career) | $87,730 – $105,472 |
| 5+ years (Experienced) | $105,472 – $122,294 |
| 10+ years (Top Earner) | $122,294 – $133,098 |
PT salary ranges estimated from BLS percentile data. Individual physical therapist compensation varies by employer, certifications, and specialization.
Physical Therapist Job Market in Needham
With only six physical therapists currently employed in Needham, the local job market remains relatively compact but competitive. The cost of living index at 108.5 indicates that expenses are slightly higher than the national average, affecting take-home pay and purchasing power for practitioners. Notably, outpatient orthopedic clinics, especially large chains like Athletico and ATI, often offer competitive pay structures that include performance bonuses tied to productivity metrics, such as visits per day and units per visit. Additionally, physical therapists with board certifications like OCS or SCS may command higher salaries due to their specialized expertise. To maximize earnings in this market, practitioners might consider seeking positions within cash-pay models or dual-practice arrangements, which can offer greater financial incentives compared to traditional insurance-based roles. Understanding these dynamics will be crucial for professionals aiming to thrive in Needham's healthcare landscape.
More salary data for Needham, MA:
Frequently Asked Questions
How much do physical therapists make in Needham, MA in 2026?
Is Needham, MA a good place to work as a physical therapist?
Can physical therapists make $100K in Needham?
What is the cost-of-living adjusted physical therapist salary in Needham?
How much does a physical therapist make per hour in Needham?
Related Pages
Compare Salaries
Career Resources
Nearby Cities in Massachusetts
Written by Alex Morgan, DPT
Career Analyst
Alex Morgan has over 10 years of experience in physical therapy. They specialize in orthopedic rehabilitation. Alex works in a private practice setting.
Methodology & Data Source
Salary figures on this page are 2026 projections based on the Bureau of Labor Statistics Occupational Employment and Wage Statistics (OEWS) survey, May 2026 release. The BLS reported a median annual salary of $102,940 for physical therapistsin the Needham metropolitan area. A 2.46% compound annual growth rate (CAGR), calculated from 6-year national BLS wage trends, was applied to project current 2026 compensation. Percentile ranges (P10–P90) represent the full salary distribution across experience levels and practice settings in this market.
Data Sources & Methodology
Salary data for Needham is estimated from official BLS state-level occupational wage data (2025), adjusted for regional cost-of-living differences using BEA RPP (Regional Price Parities).
2026 figures are projected from 2025 BLS data using a compound annual growth rate (CAGR) of 2.46%, derived from historical BLS wage trends for physical therapists (SOC 29-1123).
Compiled and verified by Alex Morgan, DPT, a licensed physical therapist with 10+ years of clinical experience. · View source data at BLS.gov