Physical Therapist Salary in Northfield, MN: $97,963 (2026)
Quick Answer:A full-time physical therapist in Northfield, MN earns a median $97,963/year (≈ $47.10/hour) in nominal terms for 2026 — projected from BLS OEWS 2025 (SOC 29-1123). Once you factor in Northfield's price level (1% below national, BEA RPP 98.5), that paycheck buys what $99,455 would nationally. Nominal pay sits 4.5% below the Minnesota state average.
Based on BLS state-level estimates · View source
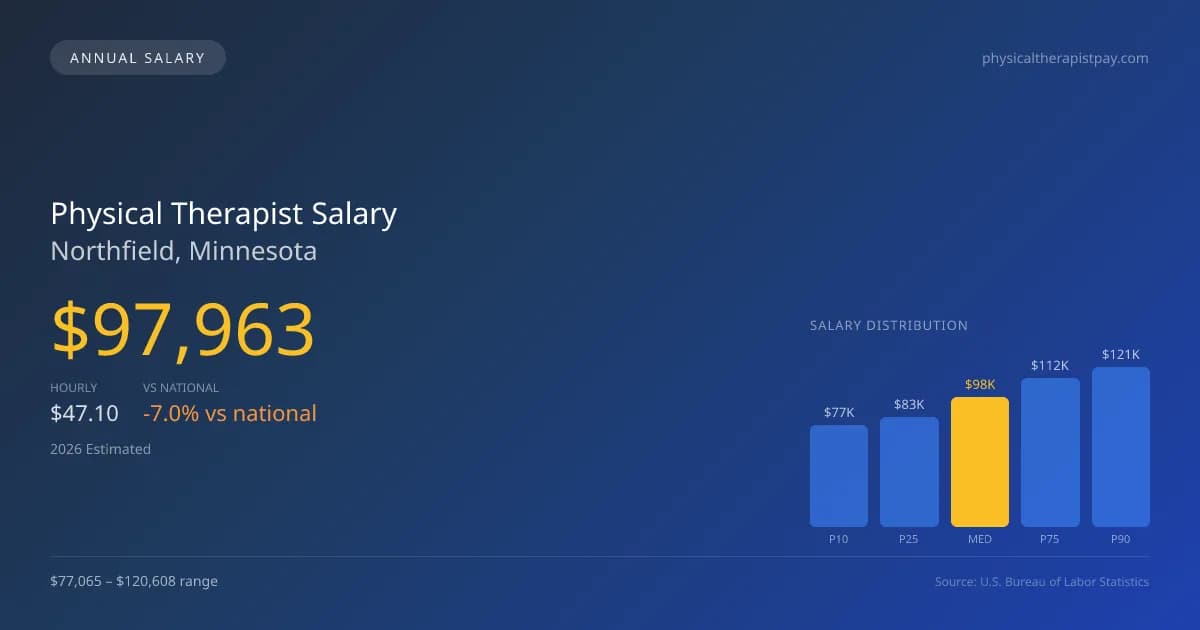
With a projected median annual salary of $97,963 in 2026, physical therapist pay in Northfield, MN, reflects an evolving market shaped by both demand for services and productivity expectations. The salary range for physical therapists in the area spans from $77,065 at the 10th percentile to $120,608 at the 90th percentile. This local estimate, derived from BLS state-level data and adjusted for regional price differences, indicates that while compensation is relatively strong, it still falls short of the national median of $105,288. As professionals consider opportunities in Northfield, understanding how productivity norms influence compensation is crucial, especially in settings where therapists are expected to manage a high volume of patient visits per day.
About the Northfield Market
Salary estimated from Minnesota average ($92,000) adjusted for local cost of living.
Salary Breakdown
| Percentile | Annual | Hourly |
|---|---|---|
| Entry Level (P10) | $77,065 | $37.05 |
| Lower Range (P25) | $83,114 | $39.96 |
| Median (P50)(typical) | $97,963 | $47.10 |
| Upper Range (P75) | $112,099 | $53.89 |
| Top Earners (P90) | $120,608 | $57.98 |
Median Salary Position
6.96% below the national average
2026 Salary Percentile Distribution in Northfield
In Northfield, MN, the physical therapist salary spread from the 10th to 90th percentile is $43,543 (2026 est.). At $97,963, the local median is 6.96% below the national median of $105,288.
Salary Calculator
At 40 hours/week in Northfield: You'd be in the lower-middle range
How Northfield Physical Therapist Pay Compares
Northfield median: $97,963/year (2026)
| Compared To | Median Salary | Northfield Pays |
|---|---|---|
| Minnesota Average | $102,579 | -4.50% less |
| National Average | $105,288 | -6.96% less |
Physical Therapists in Northfield, MN earn a median of $97,963 per year (2026 est.), which is 6.96% lower than the national median of $105,288 and 4.50% below the Minnesota state average of $102,579.
Cost-of-Living Adjusted Salary
Northfield has a cost of living 1.50% below the national average, meaning your salary goes further here.
Adjusted salary = nominal × (100 / CoL index). CoL index: 100 = national average.
Northfield, MN has a cost-of-living index of 98.5 (below the national average of 100). A physical therapist earning $97,963 nominally has purchasing power equivalent to $99,455 in an average-cost city — an effective 1.52% boost.
Compare Purchasing Power
Select a city to see how your salary compares after cost of living
Select a city above to compare purchasing power
2019 BLS Actual
$83,218
2025 BLS Actual
$95,611
2026 Current Est.
$97,963
2019–2027 Growth
+20.6%
Salary Trajectory for Physical Therapists in Northfield (2019–2027)
2019–2025: actual BLS OEWS data for this metro area. 2026+: CAGR 2.46% projection.
| Year | Annual Salary | Status |
|---|---|---|
| 2019 | $83,218 | Actual |
| 2020 | $84,678 | Actual |
| 2021 | $88,968 | Actual |
| 2022 | $90,922 | Actual |
| 2023 | $92,773 | Actual |
| 2024 | $86,522 | Actual |
| 2025 | $95,611 | Actual |
| 2026(current) | $97,963 | Estimated |
| 2027 | $100,373 | Projected |
Based on 7 years of BLS OEWS data for the Northfield metropolitan area, the median physical therapist salary grew 14.9% from $83,218 (2019) to $95,611 (2025). At a 2.46% compound annual growth rate, salaries are projected to reach $100,373 by 2027 — a total increase of $17,155 (20.61%) from 2019.
Note: Historical values (2019–2025) are actual BLS OEWS figures for the Northfield metropolitan area, sourced from annual Occupational Employment and Wage Statistics surveys. 2026–2026 figures are current estimates, and 2027 values are projections, calculated using a 2.46% CAGR derived from 7-year BLS historical data. Actual salaries may vary based on employer, experience, certifications, and local market conditions.
Salary by Experience Level
| Experience | Estimated Salary Range |
|---|---|
| 0-2 years (New Graduate) | $77,065 – $83,114 |
| 3-5 years (Mid Career) | $83,114 – $97,963 |
| 5+ years (Experienced) | $97,963 – $112,099 |
| 10+ years (Top Earner) | $112,099 – $120,608 |
PT salary ranges estimated from BLS percentile data. Individual physical therapist compensation varies by employer, certifications, and specialization.
Physical Therapist Job Market in Northfield
The job market for physical therapists in Northfield is modest, with only six employed in the area. This limited workforce, paired with a cost-of-living index of 98.5, suggests that take-home pay may stretch further than it would in higher-cost regions. Employers that typically offer the best compensation include outpatient orthopedic clinics, where productivity bonuses can enhance earnings significantly. Variations in pay arise from multiple factors: therapists who achieve board certifications like OCS or SCS may receive additional stipends, while those engaged in specialty practices, cash-pay models, or travel PT positions often command higher rates. For those aiming to maximize their physical therapist salary in Northfield, focusing on building productivity, pursuing specialization, and considering diverse practice settings can lead to greater financial rewards.
More salary data for Northfield, MN:
Frequently Asked Questions
How much do physical therapists make in Northfield, MN in 2026?
Is Northfield, MN a good place to work as a physical therapist?
Can physical therapists make $100K in Northfield?
What is the cost-of-living adjusted physical therapist salary in Northfield?
How much does a physical therapist make per hour in Northfield?
Related Pages
Compare Salaries
Career Resources
Nearby Cities in Minnesota
Written by Alex Morgan, DPT
Career Analyst
Alex Morgan has over 10 years of experience in physical therapy. They specialize in orthopedic rehabilitation. Alex works in a private practice setting.
Methodology & Data Source
Salary figures on this page are 2026 projections based on the Bureau of Labor Statistics Occupational Employment and Wage Statistics (OEWS) survey, May 2026 release. The BLS reported a median annual salary of $95,611 for physical therapistsin the Northfield metropolitan area. A 2.46% compound annual growth rate (CAGR), calculated from 6-year national BLS wage trends, was applied to project current 2026 compensation. Percentile ranges (P10–P90) represent the full salary distribution across experience levels and practice settings in this market.
Data Sources & Methodology
Salary data for Northfield is estimated from official BLS state-level occupational wage data (2025), adjusted for regional cost-of-living differences using BEA RPP (Regional Price Parities).
2026 figures are projected from 2025 BLS data using a compound annual growth rate (CAGR) of 2.46%, derived from historical BLS wage trends for physical therapists (SOC 29-1123).
Compiled and verified by Alex Morgan, DPT, a licensed physical therapist with 10+ years of clinical experience. · View source data at BLS.gov