Physical Therapist Salary in Oxford, MS: $86,086 (2026)
Quick Answer:A full-time physical therapist in Oxford, MS earns a median $86,086/year (≈ $41.38/hour) in nominal terms for 2026 — projected from BLS OEWS 2025 (SOC 29-1123). Once you factor in Oxford's price level (14% below national, BEA RPP 85.7), that paycheck buys what $100,450 would nationally. Nominal pay sits 4.6% below the Mississippi state average.
Based on BLS state-level estimates · View source
In 2026, the expected median annual salary for physical therapists in Oxford, Mississippi, is $86,086, a figure that is notably below the national median of $105,288. The salary range for these professionals is projected to be between $68,070 at the 10th percentile and $109,087 at the 90th percentile. These estimates, derived from 2025 BLS data along with regional price considerations, illustrate how the local job market can impact compensation. In Oxford, high productivity expectations often influence earnings; physical therapists may find that their pay reflects the number of patient visits they manage daily, emphasizing the importance of efficiency in this setting.
About the Oxford Market
Salary estimated from Mississippi average ($90,000) adjusted for local cost of living.
Salary Breakdown
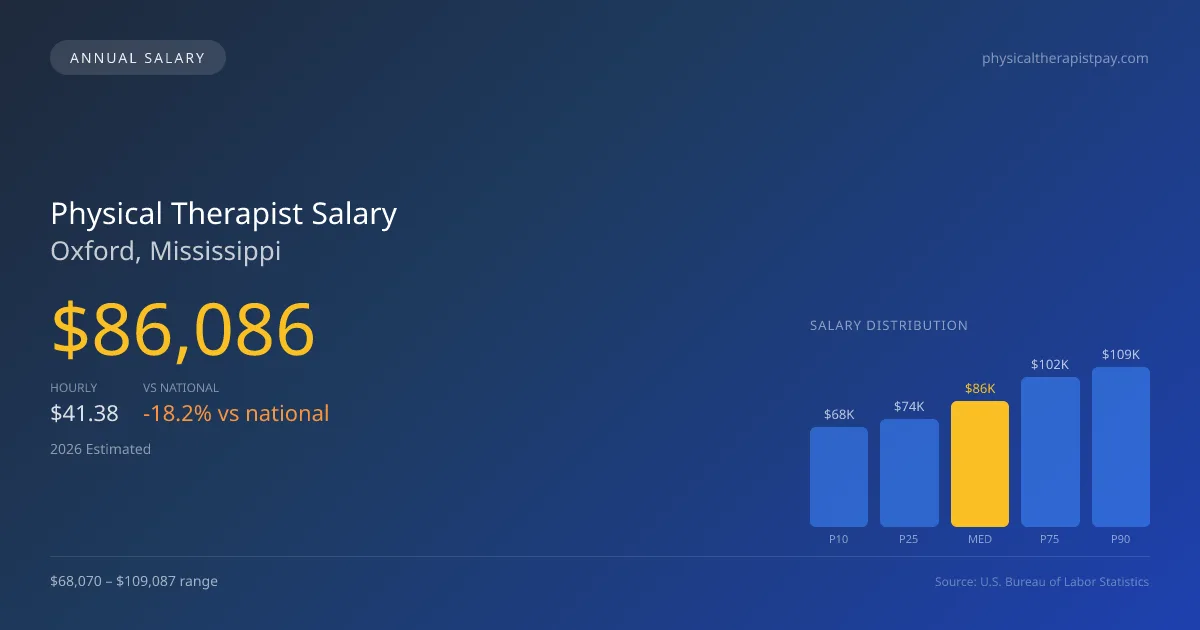
| Percentile | Annual | Hourly |
|---|---|---|
| Entry Level (P10) | $68,070 | $32.73 |
| Lower Range (P25) | $73,769 | $35.46 |
| Median (P50)(typical) | $86,086 | $41.38 |
| Upper Range (P75) | $101,948 | $49.02 |
| Top Earners (P90) | $109,087 | $52.45 |
Median Salary Position
18.24% below the national average
2026 Salary Percentile Distribution in Oxford
In Oxford, MS, the physical therapist salary spread from the 10th to 90th percentile is $41,017 (2026 est.). At $86,086, the local median is 18.24% below the national median of $105,288.
Salary Calculator
At 40 hours/week in Oxford: You'd be in the lower-middle range
How Oxford Physical Therapist Pay Compares
Oxford median: $86,086/year (2026)
| Compared To | Median Salary | Oxford Pays |
|---|---|---|
| Mississippi Average | $90,237 | -4.60% less |
| National Average | $105,288 | -18.24% less |
Physical Therapists in Oxford, MS earn a median of $86,086 per year (2026 est.), which is 18.24% lower than the national median of $105,288 and 4.60% below the Mississippi state average of $90,237.
Cost-of-Living Adjusted Salary
Oxford has a cost of living 14.30% below the national average, meaning your salary goes further here.
Adjusted salary = nominal × (100 / CoL index). CoL index: 100 = national average.
Oxford, MS has a cost-of-living index of 85.7 (below the national average of 100). A physical therapist earning $86,086 nominally has purchasing power equivalent to $100,450 in an average-cost city — an effective 16.69% boost.
Compare Purchasing Power
Select a city to see how your salary compares after cost of living
Select a city above to compare purchasing power
2019 BLS Actual
$73,128
2025 BLS Actual
$84,019
2026 Current Est.
$86,086
2019–2027 Growth
+20.6%
Salary Trajectory for Physical Therapists in Oxford (2019–2027)
2019–2025: actual BLS OEWS data for this metro area. 2026+: CAGR 2.46% projection.
| Year | Annual Salary | Status |
|---|---|---|
| 2019 | $73,128 | Actual |
| 2020 | $74,412 | Actual |
| 2021 | $78,181 | Actual |
| 2022 | $79,898 | Actual |
| 2023 | $81,525 | Actual |
| 2024 | $73,586 | Actual |
| 2025 | $84,019 | Actual |
| 2026(current) | $86,086 | Estimated |
| 2027 | $88,204 | Projected |
Based on 7 years of BLS OEWS data for the Oxford metropolitan area, the median physical therapist salary grew 14.9% from $73,128 (2019) to $84,019 (2025). At a 2.46% compound annual growth rate, salaries are projected to reach $88,204 by 2027 — a total increase of $15,076 (20.62%) from 2019.
Note: Historical values (2019–2025) are actual BLS OEWS figures for the Oxford metropolitan area, sourced from annual Occupational Employment and Wage Statistics surveys. 2026–2026 figures are current estimates, and 2027 values are projections, calculated using a 2.46% CAGR derived from 7-year BLS historical data. Actual salaries may vary based on employer, experience, certifications, and local market conditions.
Salary by Experience Level
| Experience | Estimated Salary Range |
|---|---|
| 0-2 years (New Graduate) | $68,070 – $73,769 |
| 3-5 years (Mid Career) | $73,769 – $86,086 |
| 5+ years (Experienced) | $86,086 – $101,948 |
| 10+ years (Top Earner) | $101,948 – $109,087 |
PT salary ranges estimated from BLS percentile data. Individual physical therapist compensation varies by employer, certifications, and specialization.
Physical Therapist Job Market in Oxford
The job market in Oxford employs a small cohort of physical therapists, with only five currently on staff in the area. The cost of living in the city is relatively low, reflected in a CoL index of 85.7, which positively affects take-home pay and purchasing power. Among local employers, outpatient orthopedic clinics may offer competitive compensation, often enhanced through productivity bonuses, while hospital settings might provide salary guarantees. Variations in pay are driven by factors such as specific board certifications like OCS or SCS, ownership stakes in clinics, and the choice between cash-pay or insurance models. For those looking to maximize their earnings in Oxford, focusing on high-volume clinics or exploring roles with travel PT agencies could yield better financial outcomes while navigating these challenging market conditions.
More salary data for Oxford, MS:
Frequently Asked Questions
How much do physical therapists make in Oxford, MS in 2026?
Is Oxford, MS a good place to work as a physical therapist?
Can physical therapists make $100K in Oxford?
What is the cost-of-living adjusted physical therapist salary in Oxford?
How much does a physical therapist make per hour in Oxford?
Related Pages
Compare Salaries
Career Resources
Nearby Cities in Mississippi
Written by Alex Morgan, DPT
Career Analyst
Alex Morgan has over 10 years of experience in physical therapy. They specialize in orthopedic rehabilitation. Alex works in a private practice setting.
Methodology & Data Source
Salary figures on this page are 2026 projections based on the Bureau of Labor Statistics Occupational Employment and Wage Statistics (OEWS) survey, May 2026 release. The BLS reported a median annual salary of $84,019 for physical therapistsin the Oxford metropolitan area. A 2.46% compound annual growth rate (CAGR), calculated from 6-year national BLS wage trends, was applied to project current 2026 compensation. Percentile ranges (P10–P90) represent the full salary distribution across experience levels and practice settings in this market.
Data Sources & Methodology
Salary data for Oxford is estimated from official BLS state-level occupational wage data (2025), adjusted for regional cost-of-living differences using BEA RPP (Regional Price Parities).
2026 figures are projected from 2025 BLS data using a compound annual growth rate (CAGR) of 2.46%, derived from historical BLS wage trends for physical therapists (SOC 29-1123).
Compiled and verified by Alex Morgan, DPT, a licensed physical therapist with 10+ years of clinical experience. · View source data at BLS.gov