Physical Therapist Salary in Fremont, NE: $93,481 (2026)
Quick Answer:A full-time physical therapist in Fremont, NE earns a median $93,481/year (≈ $44.94/hour) in nominal terms for 2026 — projected from BLS OEWS 2025 (SOC 29-1123). Once you factor in Fremont's price level (8% below national, BEA RPP 91.5), that paycheck buys what $102,165 would nationally. Nominal pay sits 3.0% below the Nebraska state average.
Based on BLS state-level estimates · View source
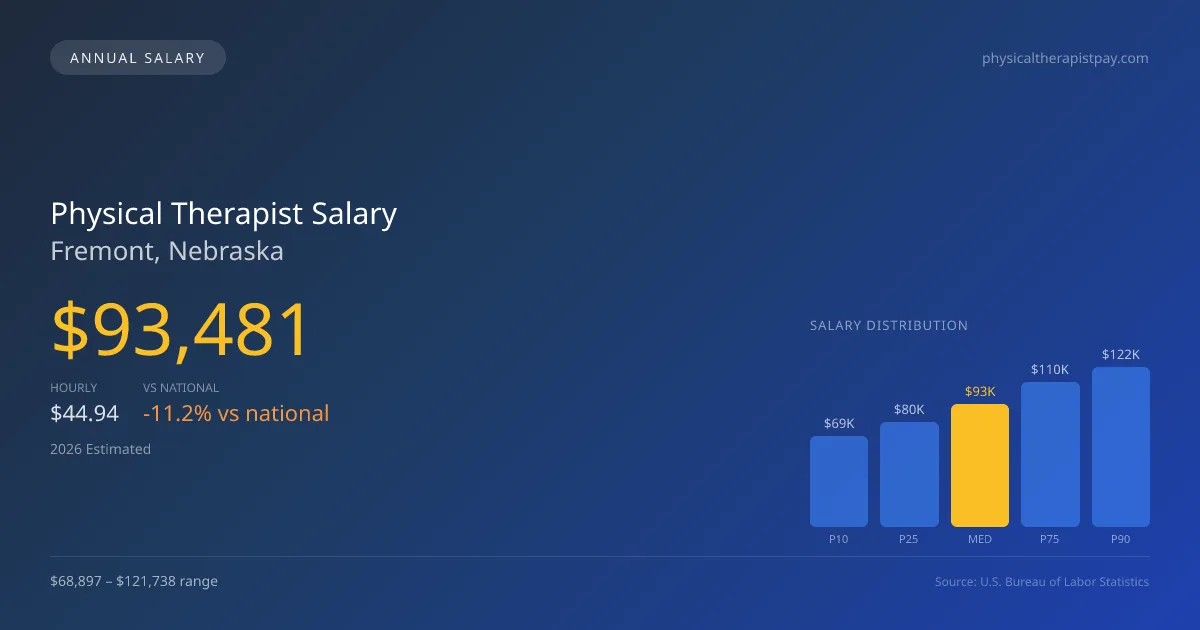
Physical therapists in Fremont, Nebraska, earn a median annual salary of $93,481 in 2026, markedly lower than the national median of $105,288. The salary range reflects a broad spectrum, starting at $68,897 at the 10th percentile and reaching up to $121,738 at the 90th percentile, showcasing the potential for higher earnings in specialized areas. These figures are derived from 2025 BLS state-level data and adjusted for the cost of living in the region. Fremont's job market is influenced by trends such as cash-pay models in sports and orthopedic specialties, potentially elevating top-end pay for those who excel in high-demand niches.
About the Fremont Market
Salary estimated from Nebraska average ($88,000) adjusted for local cost of living.
Salary Breakdown
| Percentile | Annual | Hourly |
|---|---|---|
| Entry Level (P10) | $68,897 | $33.13 |
| Lower Range (P25) | $79,943 | $38.43 |
| Median (P50)(typical) | $93,481 | $44.94 |
| Upper Range (P75) | $110,476 | $53.12 |
| Top Earners (P90) | $121,738 | $58.53 |
Median Salary Position
11.21% below the national average
2026 Salary Percentile Distribution in Fremont
In Fremont, NE, the physical therapist salary spread from the 10th to 90th percentile is $52,841 (2026 est.). At $93,481, the local median is 11.21% below the national median of $105,288.
Salary Calculator
At 40 hours/week in Fremont: You'd be in the lower-middle range
How Fremont Physical Therapist Pay Compares
Fremont median: $93,481/year (2026)
| Compared To | Median Salary | Fremont Pays |
|---|---|---|
| Nebraska Average | $96,373 | -3.00% less |
| National Average | $105,288 | -11.21% less |
Physical Therapists in Fremont, NE earn a median of $93,481 per year (2026 est.), which is 11.21% lower than the national median of $105,288 and 3.00% below the Nebraska state average of $96,373.
Cost-of-Living Adjusted Salary
Fremont has a cost of living 8.50% below the national average, meaning your salary goes further here.
Adjusted salary = nominal × (100 / CoL index). CoL index: 100 = national average.
Fremont, NE has a cost-of-living index of 91.5 (below the national average of 100). A physical therapist earning $93,481 nominally has purchasing power equivalent to $102,165 in an average-cost city — an effective 9.29% boost.
Compare Purchasing Power
Select a city to see how your salary compares after cost of living
Select a city above to compare purchasing power
2019 BLS Actual
$79,411
2025 BLS Actual
$91,237
2026 Current Est.
$93,481
2019–2027 Growth
+20.6%
Salary Trajectory for Physical Therapists in Fremont (2019–2027)
2019–2025: actual BLS OEWS data for this metro area. 2026+: CAGR 2.46% projection.
| Year | Annual Salary | Status |
|---|---|---|
| 2019 | $79,411 | Actual |
| 2020 | $80,805 | Actual |
| 2021 | $84,898 | Actual |
| 2022 | $86,762 | Actual |
| 2023 | $88,529 | Actual |
| 2024 | $78,133 | Actual |
| 2025 | $91,237 | Actual |
| 2026(current) | $93,481 | Estimated |
| 2027 | $95,781 | Projected |
Based on 7 years of BLS OEWS data for the Fremont metropolitan area, the median physical therapist salary grew 14.9% from $79,411 (2019) to $91,237 (2025). At a 2.46% compound annual growth rate, salaries are projected to reach $95,781 by 2027 — a total increase of $16,370 (20.61%) from 2019.
Note: Historical values (2019–2025) are actual BLS OEWS figures for the Fremont metropolitan area, sourced from annual Occupational Employment and Wage Statistics surveys. 2026–2026 figures are current estimates, and 2027 values are projections, calculated using a 2.46% CAGR derived from 7-year BLS historical data. Actual salaries may vary based on employer, experience, certifications, and local market conditions.
Salary by Experience Level
| Experience | Estimated Salary Range |
|---|---|
| 0-2 years (New Graduate) | $68,897 – $79,943 |
| 3-5 years (Mid Career) | $79,943 – $93,481 |
| 5+ years (Experienced) | $93,481 – $110,476 |
| 10+ years (Top Earner) | $110,476 – $121,738 |
PT salary ranges estimated from BLS percentile data. Individual physical therapist compensation varies by employer, certifications, and specialization.
Physical Therapist Job Market in Fremont
Currently, there are just four physical therapists employed in the Fremont area, which can lead to limited competition for positions but also signifies a tight-knit workforce. With a cost-of-living index of 91.5, professionals may find that their earnings provide a favorable purchasing power compared to larger cities. Outpatient orthopedic clinics, especially private practices like Athletico, tend to offer competitive salaries, driven by the expectation for productivity and specialty certifications such as Board-Certified Orthopedic Specialist (OCS) designation. The significant disparity between lower and higher compensation levels can be attributed to varied productivity models, type of insurance reimbursements, and options for cash-based services. To maximize physical therapist pay in Fremont, practitioners should consider seeking positions that encourage higher visit volumes and explore specialization avenues or travel PT opportunities, thereby enhancing their earning potential.
More salary data for Fremont, NE:
Frequently Asked Questions
How much do physical therapists make in Fremont, NE in 2026?
Is Fremont, NE a good place to work as a physical therapist?
Can physical therapists make $100K in Fremont?
What is the cost-of-living adjusted physical therapist salary in Fremont?
How much does a physical therapist make per hour in Fremont?
Related Pages
Compare Salaries
Career Resources
Nearby Cities in Nebraska
Written by Alex Morgan, DPT
Career Analyst
Alex Morgan has over 10 years of experience in physical therapy. They specialize in orthopedic rehabilitation. Alex works in a private practice setting.
Methodology & Data Source
Salary figures on this page are 2026 projections based on the Bureau of Labor Statistics Occupational Employment and Wage Statistics (OEWS) survey, May 2026 release. The BLS reported a median annual salary of $91,237 for physical therapistsin the Fremont metropolitan area. A 2.46% compound annual growth rate (CAGR), calculated from 6-year national BLS wage trends, was applied to project current 2026 compensation. Percentile ranges (P10–P90) represent the full salary distribution across experience levels and practice settings in this market.
Data Sources & Methodology
Salary data for Fremont is estimated from official BLS state-level occupational wage data (2025), adjusted for regional cost-of-living differences using BEA RPP (Regional Price Parities).
2026 figures are projected from 2025 BLS data using a compound annual growth rate (CAGR) of 2.46%, derived from historical BLS wage trends for physical therapists (SOC 29-1123).
Compiled and verified by Alex Morgan, DPT, a licensed physical therapist with 10+ years of clinical experience. · View source data at BLS.gov