Physical Therapist Salary in Papillion, NE: $89,613 (2026)
Quick Answer:A full-time physical therapist in Papillion, NE earns a median $89,613/year (≈ $43.08/hour) in nominal terms for 2026 — projected from BLS OEWS 2025 (SOC 29-1123). Once you factor in Papillion's price level (8% below national, BEA RPP 91.5), that paycheck buys what $97,938 would nationally. Nominal pay sits 7.0% below the Nebraska state average.
Based on BLS state-level estimates · View source
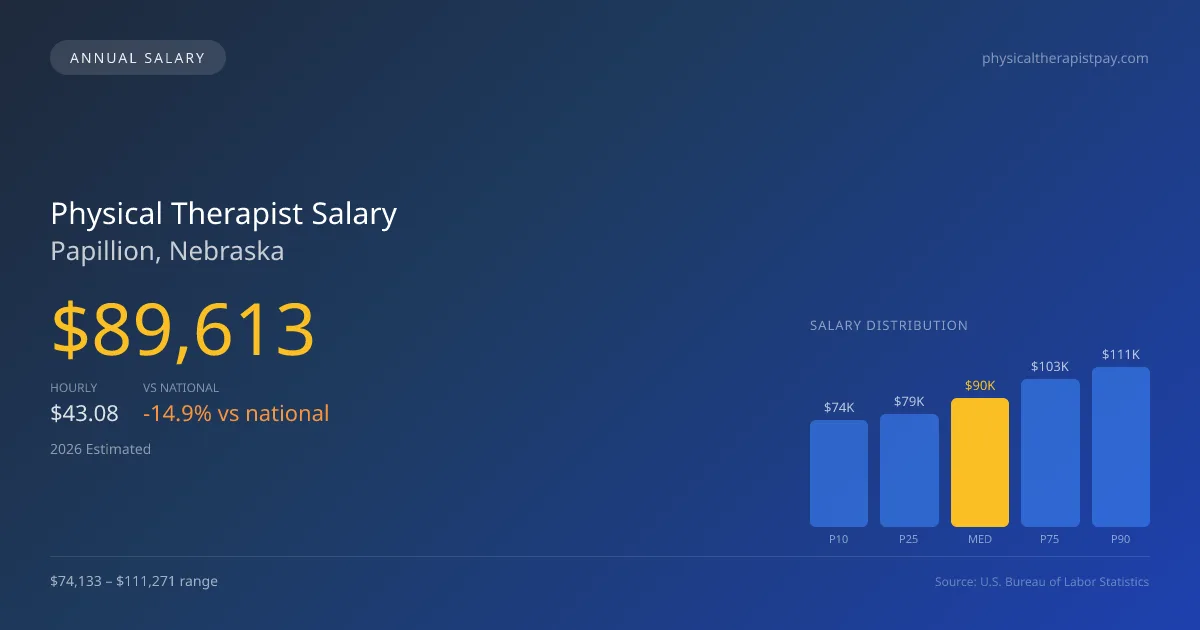
In Papillion, Nebraska, the projected median salary for physical therapists in 2026 is $89,613, which falls significantly below the national median of $105,288. The salary landscape ranges from $74,133 at the 10th percentile to as high as $111,271 at the 90th percentile, indicating a diverse market for physical therapist pay in Papillion, NE. Estimates derived from 2025 BLS data adjusted for regional price differences reflect the pay competition between outpatient clinics, hospitals, and skilled nursing facilities (SNFs). As outpatient orthopedic chains typically offer lower base salaries compared to hospital systems, the employment choices made by physical therapists here will greatly influence earnings potential.
About the Papillion Market
Salary estimated from Nebraska average ($88,000) adjusted for local cost of living.
Salary Breakdown
| Percentile | Annual | Hourly |
|---|---|---|
| Entry Level (P10) | $74,133 | $35.65 |
| Lower Range (P25) | $78,673 | $37.83 |
| Median (P50)(typical) | $89,613 | $43.08 |
| Upper Range (P75) | $103,128 | $49.58 |
| Top Earners (P90) | $111,271 | $53.49 |
Median Salary Position
14.89% below the national average
2026 Salary Percentile Distribution in Papillion
In Papillion, NE, the physical therapist salary spread from the 10th to 90th percentile is $37,138 (2026 est.). At $89,613, the local median is 14.89% below the national median of $105,288.
Salary Calculator
At 40 hours/week in Papillion: You'd be in the lower-middle range
How Papillion Physical Therapist Pay Compares
Papillion median: $89,613/year (2026)
| Compared To | Median Salary | Papillion Pays |
|---|---|---|
| Nebraska Average | $96,358 | -7.00% less |
| National Average | $105,288 | -14.89% less |
Physical Therapists in Papillion, NE earn a median of $89,613 per year (2026 est.), which is 14.89% lower than the national median of $105,288 and 7.00% below the Nebraska state average of $96,358.
Cost-of-Living Adjusted Salary
Papillion has a cost of living 8.50% below the national average, meaning your salary goes further here.
Adjusted salary = nominal × (100 / CoL index). CoL index: 100 = national average.
Papillion, NE has a cost-of-living index of 91.5 (below the national average of 100). A physical therapist earning $89,613 nominally has purchasing power equivalent to $97,938 in an average-cost city — an effective 9.29% boost.
Compare Purchasing Power
Select a city to see how your salary compares after cost of living
Select a city above to compare purchasing power
2019 BLS Actual
$76,124
2025 BLS Actual
$87,461
2026 Current Est.
$89,613
2019–2027 Growth
+20.6%
Salary Trajectory for Physical Therapists in Papillion (2019–2027)
2019–2025: actual BLS OEWS data for this metro area. 2026+: CAGR 2.46% projection.
| Year | Annual Salary | Status |
|---|---|---|
| 2019 | $76,124 | Actual |
| 2020 | $77,460 | Actual |
| 2021 | $81,384 | Actual |
| 2022 | $83,171 | Actual |
| 2023 | $84,865 | Actual |
| 2024 | $74,899 | Actual |
| 2025 | $87,461 | Actual |
| 2026(current) | $89,613 | Estimated |
| 2027 | $91,817 | Projected |
Based on 7 years of BLS OEWS data for the Papillion metropolitan area, the median physical therapist salary grew 14.9% from $76,124 (2019) to $87,461 (2025). At a 2.46% compound annual growth rate, salaries are projected to reach $91,817 by 2027 — a total increase of $15,693 (20.62%) from 2019.
Note: Historical values (2019–2025) are actual BLS OEWS figures for the Papillion metropolitan area, sourced from annual Occupational Employment and Wage Statistics surveys. 2026–2026 figures are current estimates, and 2027 values are projections, calculated using a 2.46% CAGR derived from 7-year BLS historical data. Actual salaries may vary based on employer, experience, certifications, and local market conditions.
Salary by Experience Level
| Experience | Estimated Salary Range |
|---|---|
| 0-2 years (New Graduate) | $74,133 – $78,673 |
| 3-5 years (Mid Career) | $78,673 – $89,613 |
| 5+ years (Experienced) | $89,613 – $103,128 |
| 10+ years (Top Earner) | $103,128 – $111,271 |
PT salary ranges estimated from BLS percentile data. Individual physical therapist compensation varies by employer, certifications, and specialization.
Physical Therapist Job Market in Papillion
Looking at the local job market, Papillion employs only five physical therapists, which may indicate a tighter labor pool for the professionals considering this area. The low cost-of-living index of 91.5 means that even though the nominal salaries may be lower than the national average, the purchasing power could be relatively favorable. Employers such as outpatient orthopedic clinics may offer varying pay scales, while inpatient rehab settings can command higher wages due to their more intensive care models. Factors such as productivity expectations, board certifications, and practice management choices (enhanced rates for cash-pay models versus traditional insurance) can create a significant spread between high and low earnings. For those seeking to maximize their physical therapist pay in Papillion, NE, achieving board specialization or considering productivity-based compensation through high-efficiency clinic practices could yield positive financial results.
More salary data for Papillion, NE:
Frequently Asked Questions
How much do physical therapists make in Papillion, NE in 2026?
Is Papillion, NE a good place to work as a physical therapist?
Can physical therapists make $100K in Papillion?
What is the cost-of-living adjusted physical therapist salary in Papillion?
How much does a physical therapist make per hour in Papillion?
Related Pages
Compare Salaries
Career Resources
Nearby Cities in Nebraska
Written by Alex Morgan, DPT
Career Analyst
Alex Morgan has over 10 years of experience in physical therapy. They specialize in orthopedic rehabilitation. Alex works in a private practice setting.
Methodology & Data Source
Salary figures on this page are 2026 projections based on the Bureau of Labor Statistics Occupational Employment and Wage Statistics (OEWS) survey, May 2026 release. The BLS reported a median annual salary of $87,461 for physical therapistsin the Papillion metropolitan area. A 2.46% compound annual growth rate (CAGR), calculated from 6-year national BLS wage trends, was applied to project current 2026 compensation. Percentile ranges (P10–P90) represent the full salary distribution across experience levels and practice settings in this market.
Data Sources & Methodology
Salary data for Papillion is estimated from official BLS state-level occupational wage data (2025), adjusted for regional cost-of-living differences using BEA RPP (Regional Price Parities).
2026 figures are projected from 2025 BLS data using a compound annual growth rate (CAGR) of 2.46%, derived from historical BLS wage trends for physical therapists (SOC 29-1123).
Compiled and verified by Alex Morgan, DPT, a licensed physical therapist with 10+ years of clinical experience. · View source data at BLS.gov