Physical Therapist Salary in Rochester, NY: $85,114 (2026)
Quick Answer:A full-time physical therapist in Rochester, NY earns a median $85,114/year (≈ $40.92/hour) in nominal terms for 2026 — projected from BLS OEWS 2025 (SOC 29-1123). Once you factor in Rochester's price level (3% below national, BEA RPP 97.0), that paycheck buys what $87,715 would nationally. Nominal pay sits 11.6% below the New York state average.
Official BLS data · View source
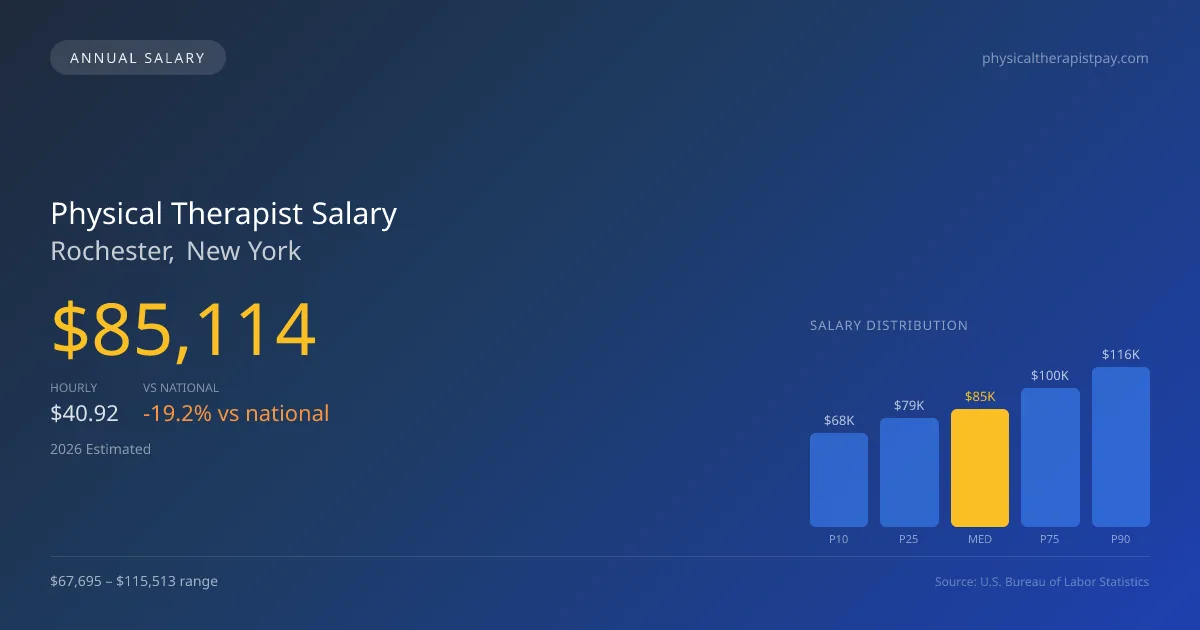
Projected data for 2026 indicates that physical therapist salary in Rochester, NY, averages around $85,114 annually. This figure is significantly lower than the national median of $105,288, reflecting a notable 19.16% difference. The reported salary range shows variability within the field, with entry-level therapists earning approximately $67,695, while top earners can make up to $115,513. These estimates, based on 2025 BLS OEWS data, project a steady growth rate of 2.46% annually, reflecting the evolving demands in this profession. As productivity expectations build pressure on physical therapists to optimize visits per day, this has a direct impact on effective compensation strategies in Rochester's healthcare market.
Salary Breakdown
| Percentile | Annual | Hourly |
|---|---|---|
| Entry Level (P10) | $67,695 | $32.55 |
| Lower Range (P25) | $78,700 | $37.84 |
| Median (P50)(typical) | $85,114 | $40.92 |
| Upper Range (P75) | $100,103 | $48.13 |
| Top Earners (P90) | $115,513 | $55.53 |
Median Salary Position
19.16% below the national average
2026 Salary Percentile Distribution in Rochester
In Rochester, NY, the physical therapist salary spread from the 10th to 90th percentile is $47,818 (2026 est.). At $85,114, the local median is 19.16% below the national median of $105,288.
Salary Calculator
At 40 hours/week in Rochester: You'd be in the lower-middle range
How Rochester Physical Therapist Pay Compares
Rochester median: $85,114/year (2026)
| Compared To | Median Salary | Rochester Pays |
|---|---|---|
| New York Average | $96,282 | -11.60% less |
| National Average | $105,288 | -19.16% less |
Physical Therapists in Rochester, NY earn a median of $85,114 per year (2026 est.), which is 19.16% lower than the national median of $105,288 and 11.60% below the New York state average of $96,282.
Cost-of-Living Adjusted Salary
Rochester has a cost of living 2.97% below the national average, meaning your salary goes further here.
Adjusted salary = nominal × (100 / CoL index). CoL index: 100 = national average.
Rochester, NY has a cost-of-living index of 97.035 (below the national average of 100). A physical therapist earning $85,114 nominally has purchasing power equivalent to $87,715 in an average-cost city — an effective 3.06% boost.
Compare Purchasing Power
Select a city to see how your salary compares after cost of living
Select a city above to compare purchasing power
2019 BLS Actual
$76,270
2025 BLS Actual
$83,070
2026 Current Est.
$85,114
2019–2027 Growth
+14.3%
Salary Trajectory for Physical Therapists in Rochester (2019–2027)
2019–2025: actual BLS OEWS data for this metro area. 2026+: CAGR 2.46% projection.
| Year | Annual Salary | Status |
|---|---|---|
| 2019 | $76,270 | Actual |
| 2020 | $79,730 | Actual |
| 2021 | $77,890 | Actual |
| 2022 | $80,950 | Actual |
| 2023 | $79,560 | Actual |
| 2024 | $78,550 | Actual |
| 2025 | $83,070 | Actual |
| 2026(current) | $85,114 | Estimated |
| 2027 | $87,207 | Projected |
Based on 7 years of BLS OEWS data for the Rochester metropolitan area, the median physical therapist salary grew 8.9% from $76,270 (2019) to $83,070 (2025). At a 2.46% compound annual growth rate, salaries are projected to reach $87,207 by 2027 — a total increase of $10,937 (14.34%) from 2019.
Note: Historical values (2019–2025) are actual BLS OEWS figures for the Rochester metropolitan area, sourced from annual Occupational Employment and Wage Statistics surveys. 2026–2026 figures are current estimates, and 2027 values are projections, calculated using a 2.46% CAGR derived from 7-year BLS historical data. Actual salaries may vary based on employer, experience, certifications, and local market conditions.
Salary by Experience Level
| Experience | Estimated Salary Range |
|---|---|
| 0-2 years (New Graduate) | $67,695 – $78,700 |
| 3-5 years (Mid Career) | $78,700 – $85,114 |
| 5+ years (Experienced) | $85,114 – $100,103 |
| 10+ years (Top Earner) | $100,103 – $115,513 |
PT salary ranges estimated from BLS percentile data. Individual physical therapist compensation varies by employer, certifications, and specialization.
Physical Therapist Job Market in Rochester
Rochester is home to about 1,140 physical therapists, contributing to a competitive local job market. The cost-of-living index, sitting at 97.035, suggests that living expenses here are relatively manageable, which plays a role in take-home purchasing power for practitioners. Among various employers, outpatient orthopedic clinics, whether private practices or chains like Athletico, typically offer the highest compensation packages. Factors such as board certifications (OCS, SCS) can provide additional stipends, while productivity expectations and the models of reimbursement—specifically cash-pay versus insurance-based practices—further influence salary variations. Understanding how much do physical therapists make in Rochester entails strategizing around these elements, as higher pay can often be found in specialized settings or through travel PT positions, where demand can further inflate compensation opportunities.
More salary data for Rochester, NY:
Frequently Asked Questions
How much do physical therapists make in Rochester, NY in 2026?
Is Rochester, NY a good place to work as a physical therapist?
Can physical therapists make $100K in Rochester?
What is the cost-of-living adjusted physical therapist salary in Rochester?
How much does a physical therapist make per hour in Rochester?
Related Pages
Compare Salaries
Career Resources
Nearby Cities in New York
Written by Alex Morgan, DPT
Career Analyst
Alex Morgan has over 10 years of experience in physical therapy. They specialize in orthopedic rehabilitation. Alex works in a private practice setting.
Methodology & Data Source
Salary figures on this page are 2026 projections based on the Bureau of Labor Statistics Occupational Employment and Wage Statistics (OEWS) survey, May 2026 release. The BLS reported a median annual salary of $83,070 for physical therapistsin the Rochester metropolitan area. A 2.46% compound annual growth rate (CAGR), calculated from 6-year national BLS wage trends, was applied to project current 2026 compensation. Percentile ranges (P10–P90) represent the full salary distribution across experience levels and practice settings in this market.
Data Sources & Methodology
Source: BLS, OEWS, 7-year dataset (–). Per-city data from annual BLS metropolitan area surveys.
2026 figures are projected from 2025 BLS data using a compound annual growth rate (CAGR) of 2.46%, derived from historical BLS wage trends for physical therapists (SOC 29-1123).
Compiled and verified by Alex Morgan, DPT, a licensed physical therapist with 10+ years of clinical experience. · View source data at BLS.gov