Physical Therapist Salary in Charlotte, NC: $103,546 (2026)
Quick Answer:A full-time physical therapist in Charlotte, NC earns a median $103,546/year (≈ $49.79/hour) in nominal terms for 2026 — projected from BLS OEWS 2025 (SOC 29-1123). Once you factor in Charlotte's price level (3% below national, BEA RPP 97.3), that paycheck buys what $106,367 would nationally. Nominal pay sits 1.2% above the North Carolina state average.
Official BLS data · View source
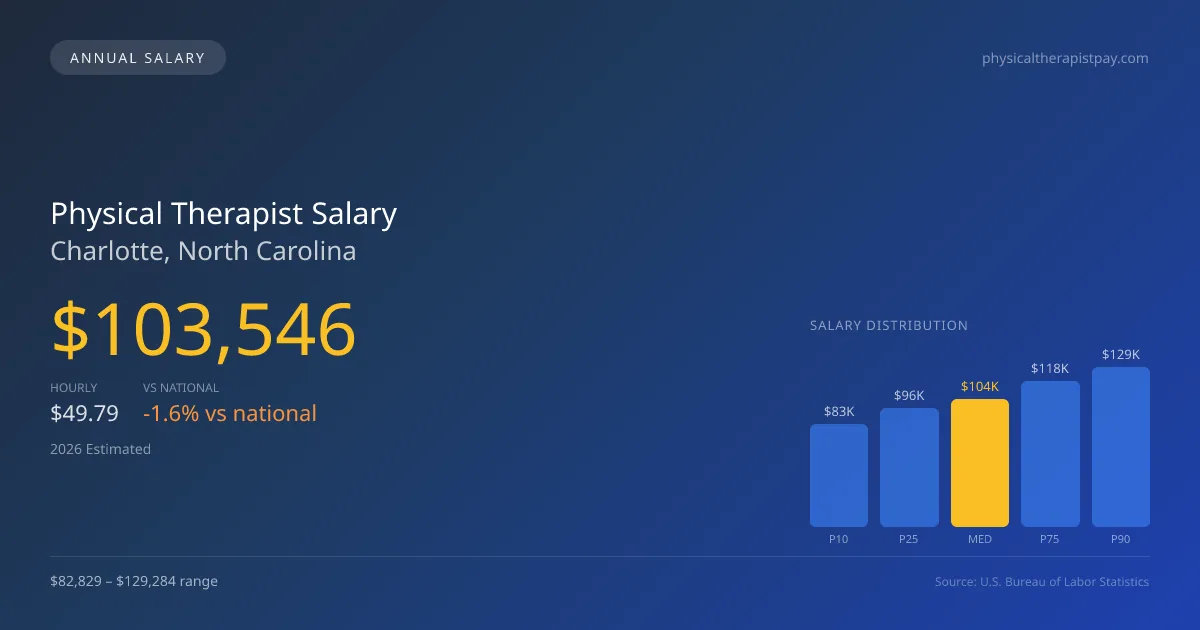
Charlotte's physical therapists can expect a median annual salary of $103,546 in 2026, slightly below the national median of $105,288. The salary range for these professionals spans from $82,829 at the 10th percentile to $129,284 at the 90th percentile, indicating a competitive market. This data, derived from 2025 BLS OEWS surveys, reflects the growing cash-pay trend among sports and orthopedic specialists in Charlotte. Such practices are increasingly seeking experienced therapists, influencing top-end pay rates. As competition in this burgeoning field intensifies, therapists can capitalize on the city's health-conscious culture and growing client demand.
Salary Breakdown
| Percentile | Annual | Hourly |
|---|---|---|
| Entry Level (P10) | $82,829 | $39.82 |
| Lower Range (P25) | $96,384 | $46.34 |
| Median (P50)(typical) | $103,546 | $49.79 |
| Upper Range (P75) | $118,208 | $56.83 |
| Top Earners (P90) | $129,284 | $62.16 |
Median Salary Position
1.65% below the national average
2026 Salary Percentile Distribution in Charlotte
In Charlotte, NC, the physical therapist salary spread from the 10th to 90th percentile is $46,455 (2026 est.). At $103,546, the local median is 1.65% below the national median of $105,288.
Salary Calculator
At 40 hours/week in Charlotte: You'd be in the lower-middle range
How Charlotte Physical Therapist Pay Compares
Charlotte median: $103,546/year (2026)
| Compared To | Median Salary | Charlotte Pays |
|---|---|---|
| North Carolina Average | $102,318 | +1.20% more |
| National Average | $105,288 | -1.65% less |
Physical Therapists in Charlotte, NC earn a median of $103,546 per year (2026 est.), which is 1.65% lower than the national median of $105,288 and 1.20% above the North Carolina state average of $102,318.
Cost-of-Living Adjusted Salary
Charlotte has a cost of living 2.65% below the national average, meaning your salary goes further here.
Adjusted salary = nominal × (100 / CoL index). CoL index: 100 = national average.
Charlotte, NC has a cost-of-living index of 97.348 (below the national average of 100). A physical therapist earning $103,546 nominally has purchasing power equivalent to $106,367 in an average-cost city — an effective 2.72% boost.
Compare Purchasing Power
Select a city to see how your salary compares after cost of living
Select a city above to compare purchasing power
2019 BLS Actual
$87,100
2025 BLS Actual
$101,060
2026 Current Est.
$103,546
2019–2027 Growth
+21.8%
Salary Trajectory for Physical Therapists in Charlotte (2019–2027)
2019–2025: actual BLS OEWS data for this metro area. 2026+: CAGR 2.46% projection.
| Year | Annual Salary | Status |
|---|---|---|
| 2019 | $87,100 | Actual |
| 2020 | $88,400 | Actual |
| 2021 | $82,740 | Actual |
| 2022 | $92,870 | Actual |
| 2023 | $96,780 | Actual |
| 2024 | $100,310 | Actual |
| 2025 | $101,060 | Actual |
| 2026(current) | $103,546 | Estimated |
| 2027 | $106,093 | Projected |
Based on 7 years of BLS OEWS data for the Charlotte metropolitan area, the median physical therapist salary grew 16.0% from $87,100 (2019) to $101,060 (2025). At a 2.46% compound annual growth rate, salaries are projected to reach $106,093 by 2027 — a total increase of $18,993 (21.81%) from 2019.
Note: Historical values (2019–2025) are actual BLS OEWS figures for the Charlotte metropolitan area, sourced from annual Occupational Employment and Wage Statistics surveys. 2026–2026 figures are current estimates, and 2027 values are projections, calculated using a 2.46% CAGR derived from 7-year BLS historical data. Actual salaries may vary based on employer, experience, certifications, and local market conditions.
Salary by Experience Level
| Experience | Estimated Salary Range |
|---|---|
| 0-2 years (New Graduate) | $82,829 – $96,384 |
| 3-5 years (Mid Career) | $96,384 – $103,546 |
| 5+ years (Experienced) | $103,546 – $118,208 |
| 10+ years (Top Earner) | $118,208 – $129,284 |
PT salary ranges estimated from BLS percentile data. Individual physical therapist compensation varies by employer, certifications, and specialization.
Physical Therapist Job Market in Charlotte
With approximately 1,680 physical therapists currently employed in Charlotte, the local job market demonstrates strong demand in the field. The cost of living index at 97.348 offers a favorable environment for take-home purchasing power, making it reasonably affordable for therapists working in the area. Outpatient orthopedic clinics, including chains like ATI and Athletico, and local hospital systems typically offer the highest salaries; however, competition and productivity expectations are fierce. Income variations arise from factors like units per visit, board certification stipends for OCS and SCS, and practice models—where cash-pay structures often yield higher compensation. To maximize pay in Charlotte NC, therapists should explore opportunities at high-reimbursement facilities, pursue specialization certifications, and consider engaging in private practice or travel PT roles that often come with premium pay.
More salary data for Charlotte, NC:
Frequently Asked Questions
How much do physical therapists make in Charlotte, NC in 2026?
Is Charlotte, NC a good place to work as a physical therapist?
Can physical therapists make $100K in Charlotte?
What is the cost-of-living adjusted physical therapist salary in Charlotte?
How much does a physical therapist make per hour in Charlotte?
Related Pages
Compare Salaries
Career Resources
Nearby Cities in North Carolina
Written by Alex Morgan, DPT
Career Analyst
Alex Morgan has over 10 years of experience in physical therapy. They specialize in orthopedic rehabilitation. Alex works in a private practice setting.
Methodology & Data Source
Salary figures on this page are 2026 projections based on the Bureau of Labor Statistics Occupational Employment and Wage Statistics (OEWS) survey, May 2026 release. The BLS reported a median annual salary of $101,060 for physical therapistsin the Charlotte metropolitan area. A 2.46% compound annual growth rate (CAGR), calculated from 6-year national BLS wage trends, was applied to project current 2026 compensation. Percentile ranges (P10–P90) represent the full salary distribution across experience levels and practice settings in this market.
Data Sources & Methodology
Source: BLS, OEWS, 7-year dataset (–). Per-city data from annual BLS metropolitan area surveys.
2026 figures are projected from 2025 BLS data using a compound annual growth rate (CAGR) of 2.46%, derived from historical BLS wage trends for physical therapists (SOC 29-1123).
Compiled and verified by Alex Morgan, DPT, a licensed physical therapist with 10+ years of clinical experience. · View source data at BLS.gov