Physical Therapist Salary in Cincinnati, OH: $105,421 (2026)
Quick Answer:A full-time physical therapist in Cincinnati, OH earns a median $105,421/year (≈ $50.69/hour) in nominal terms for 2026 — projected from BLS OEWS 2025 (SOC 29-1123). Once you factor in Cincinnati's price level (5% below national, BEA RPP 95.4), that paycheck buys what $110,539 would nationally. Nominal pay sits 0.1% above the Ohio state average.
Official BLS data · View source
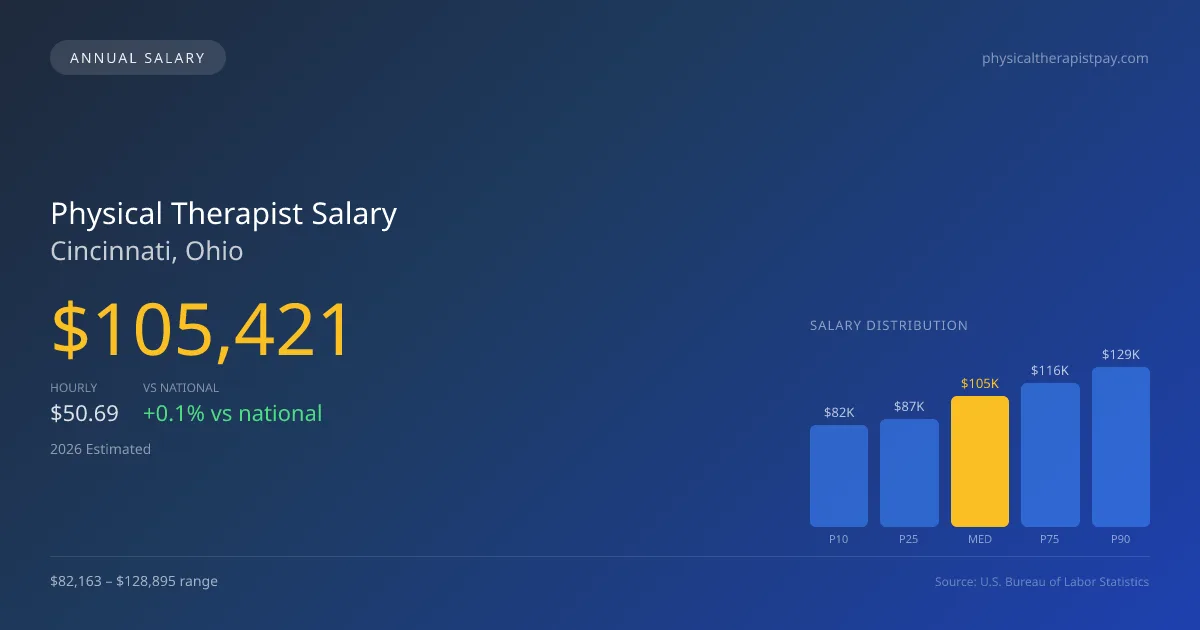
For physical therapists in Cincinnati, the projected median annual salary in 2026 is $105,421, which reflects a competitive position in the local market compared to the national median of $105,288. The salary range varies significantly, from $82,163 at the 10th percentile to as high as $128,895 at the 90th percentile. These figures, drawn from projected estimates based on 2025 BLS OEWS data, illustrate the diverse earning potential for physical therapists in the area. The job market in Cincinnati shows favorable conditions, driven partly by the industry's increasing demand, which places expectations on productivity and efficiency in patient care, ultimately influencing compensation levels in outpatient settings.
Salary Breakdown
| Percentile | Annual | Hourly |
|---|---|---|
| Entry Level (P10) | $82,163 | $39.51 |
| Lower Range (P25) | $86,794 | $41.73 |
| Median (P50)(typical) | $105,421 | $50.69 |
| Upper Range (P75) | $115,821 | $55.69 |
| Top Earners (P90) | $128,895 | $61.97 |
Median Salary Position
0.13% above the national average
2026 Salary Percentile Distribution in Cincinnati
In Cincinnati, OH, the physical therapist salary spread from the 10th to 90th percentile is $46,732 (2026 est.). At $105,421, the local median is 0.13% above the national median of $105,288.
Salary Calculator
At 40 hours/week in Cincinnati: You'd be above the median
How Cincinnati Physical Therapist Pay Compares
Cincinnati median: $105,421/year (2026)
| Compared To | Median Salary | Cincinnati Pays |
|---|---|---|
| Ohio Average | $105,316 | +0.10% more |
| National Average | $105,288 | +0.13% more |
Physical Therapists in Cincinnati, OH earn a median of $105,421 per year (2026 est.), which is 0.13% higher than the national median of $105,288 and 0.10% above the Ohio state average of $105,316.
Cost-of-Living Adjusted Salary
Cincinnati has a cost of living 4.63% below the national average, meaning your salary goes further here.
Adjusted salary = nominal × (100 / CoL index). CoL index: 100 = national average.
Cincinnati, OH has a cost-of-living index of 95.37 (below the national average of 100). A physical therapist earning $105,421 nominally has purchasing power equivalent to $110,539 in an average-cost city — an effective 4.85% boost.
Compare Purchasing Power
Select a city to see how your salary compares after cost of living
Select a city above to compare purchasing power
2019 BLS Actual
$89,610
2025 BLS Actual
$102,890
2026 Current Est.
$105,421
2019–2027 Growth
+20.5%
Salary Trajectory for Physical Therapists in Cincinnati (2019–2027)
2019–2025: actual BLS OEWS data for this metro area. 2026+: CAGR 2.46% projection.
| Year | Annual Salary | Status |
|---|---|---|
| 2019 | $89,610 | Actual |
| 2020 | $92,490 | Actual |
| 2021 | $96,110 | Actual |
| 2022 | $99,570 | Actual |
| 2023 | $100,980 | Actual |
| 2024 | $100,070 | Actual |
| 2025 | $102,890 | Actual |
| 2026(current) | $105,421 | Estimated |
| 2027 | $108,014 | Projected |
Based on 7 years of BLS OEWS data for the Cincinnati metropolitan area, the median physical therapist salary grew 14.8% from $89,610 (2019) to $102,890 (2025). At a 2.46% compound annual growth rate, salaries are projected to reach $108,014 by 2027 — a total increase of $18,404 (20.54%) from 2019.
Note: Historical values (2019–2025) are actual BLS OEWS figures for the Cincinnati metropolitan area, sourced from annual Occupational Employment and Wage Statistics surveys. 2026–2026 figures are current estimates, and 2027 values are projections, calculated using a 2.46% CAGR derived from 7-year BLS historical data. Actual salaries may vary based on employer, experience, certifications, and local market conditions.
Salary by Experience Level
| Experience | Estimated Salary Range |
|---|---|
| 0-2 years (New Graduate) | $82,163 – $86,794 |
| 3-5 years (Mid Career) | $86,794 – $105,421 |
| 5+ years (Experienced) | $105,421 – $115,821 |
| 10+ years (Top Earner) | $115,821 – $128,895 |
PT salary ranges estimated from BLS percentile data. Individual physical therapist compensation varies by employer, certifications, and specialization.
Physical Therapist Job Market in Cincinnati
With approximately 2,090 physical therapists currently employed in Cincinnati, the job market remains robust, albeit under pressure from rising cost-of-living considerations reflected in a cost index of 95.37. Notably, outpatient orthopedic clinics and specialized settings, such as pediatric or sports rehabilitation centers, tend to offer the highest pay, often incentivized by productivity models. The spread between salaries can be attributed to various factors, including board certifications, clinic ownership models, and the decision between cash-pay versus insurance-based services. To maximize earning potential in the Cincinnati market, professionals should consider pursuing advanced certifications like OCS or SCS, aligning with high-demand practice areas, and negotiating contracts that leverage productivity-based bonuses. By actively engaging in these strategies, physical therapists can enhance their earning power amid a dynamic and evolving landscape.
More salary data for Cincinnati, OH:
Frequently Asked Questions
How much do physical therapists make in Cincinnati, OH in 2026?
Is Cincinnati, OH a good place to work as a physical therapist?
Can physical therapists make $100K in Cincinnati?
What is the cost-of-living adjusted physical therapist salary in Cincinnati?
How much does a physical therapist make per hour in Cincinnati?
Related Pages
Compare Salaries
Career Resources
Nearby Cities in Ohio
Written by Alex Morgan, DPT
Career Analyst
Alex Morgan has over 10 years of experience in physical therapy. They specialize in orthopedic rehabilitation. Alex works in a private practice setting.
Methodology & Data Source
Salary figures on this page are 2026 projections based on the Bureau of Labor Statistics Occupational Employment and Wage Statistics (OEWS) survey, May 2026 release. The BLS reported a median annual salary of $102,890 for physical therapistsin the Cincinnati metropolitan area. A 2.46% compound annual growth rate (CAGR), calculated from 6-year national BLS wage trends, was applied to project current 2026 compensation. Percentile ranges (P10–P90) represent the full salary distribution across experience levels and practice settings in this market.
Data Sources & Methodology
Source: BLS, OEWS, 7-year dataset (–). Per-city data from annual BLS metropolitan area surveys.
2026 figures are projected from 2025 BLS data using a compound annual growth rate (CAGR) of 2.46%, derived from historical BLS wage trends for physical therapists (SOC 29-1123).
Compiled and verified by Alex Morgan, DPT, a licensed physical therapist with 10+ years of clinical experience. · View source data at BLS.gov