Physical Therapist Salary in Tulsa, OK: $103,321 (2026)
Quick Answer:A full-time physical therapist in Tulsa, OK earns a median $103,321/year (≈ $49.67/hour) in nominal terms for 2026 — projected from BLS OEWS 2025 (SOC 29-1123). Once you factor in Tulsa's price level (11% below national, BEA RPP 89.2), that paycheck buys what $115,813 would nationally. Nominal pay sits 10.4% above the Oklahoma state average.
Official BLS data · View source
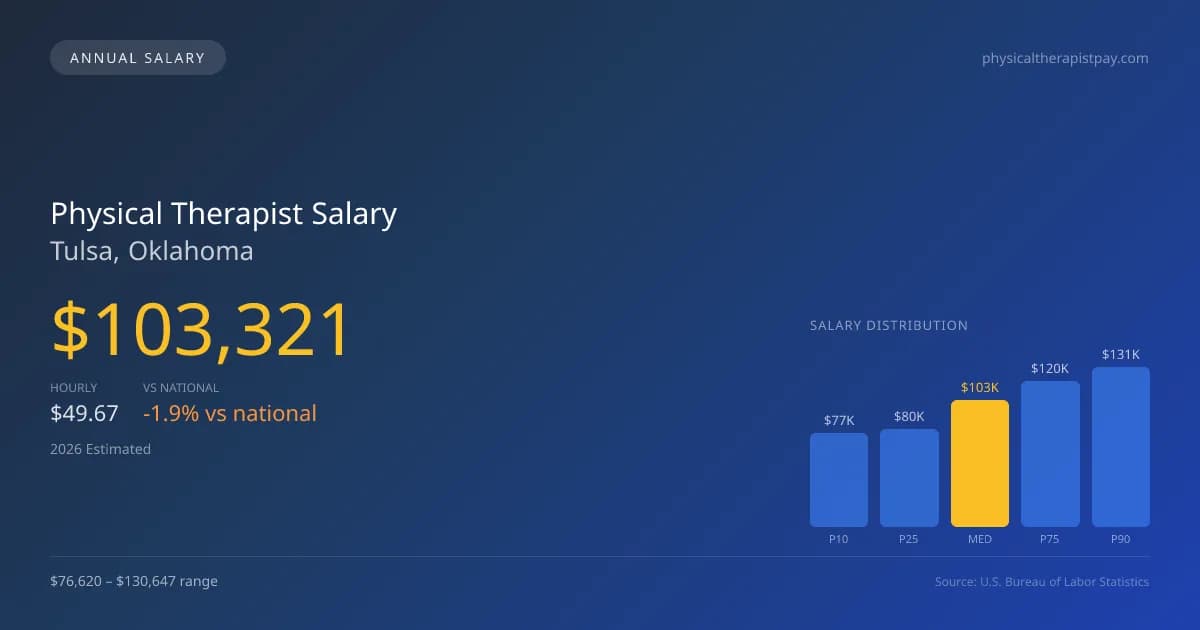
In Tulsa, Oklahoma, the projected median annual salary for a physical therapist reaches $103,321 in 2026, which is just slightly below the national median of $105,288. The salary range for physical therapists in this city varies significantly, from approximately $76,620 at the lower end (P10) to about $130,647 at the higher end (P90). These figures, derived from the official Bureau of Labor Statistics (BLS) Occupational Employment and Wage Statistics surveys, reflect the increasing financial expectations placed on therapists due to productivity demands in the industry. As healthcare systems continue to emphasize visits-per-day metrics, those working in high-volume facilities may find their compensation directly linked to how effectively they handle patient loads.
Salary Breakdown
| Percentile | Annual | Hourly |
|---|---|---|
| Entry Level (P10) | $76,620 | $36.83 |
| Lower Range (P25) | $79,960 | $38.44 |
| Median (P50)(typical) | $103,321 | $49.67 |
| Upper Range (P75) | $119,530 | $57.47 |
| Top Earners (P90) | $130,647 | $62.81 |
Median Salary Position
1.87% below the national average
2026 Salary Percentile Distribution in Tulsa
In Tulsa, OK, the physical therapist salary spread from the 10th to 90th percentile is $54,027 (2026 est.). At $103,321, the local median is 1.87% below the national median of $105,288.
Salary Calculator
At 40 hours/week in Tulsa: You'd be in the lower-middle range
How Tulsa Physical Therapist Pay Compares
Tulsa median: $103,321/year (2026)
| Compared To | Median Salary | Tulsa Pays |
|---|---|---|
| Oklahoma Average | $93,588 | +10.40% more |
| National Average | $105,288 | -1.87% less |
Physical Therapists in Tulsa, OK earn a median of $103,321 per year (2026 est.), which is 1.87% lower than the national median of $105,288 and 10.40% above the Oklahoma state average of $93,588.
Cost-of-Living Adjusted Salary
Tulsa has a cost of living 10.79% below the national average, meaning your salary goes further here.
Adjusted salary = nominal × (100 / CoL index). CoL index: 100 = national average.
Tulsa, OK has a cost-of-living index of 89.214 (below the national average of 100). A physical therapist earning $103,321 nominally has purchasing power equivalent to $115,813 in an average-cost city — an effective 12.09% boost.
Compare Purchasing Power
Select a city to see how your salary compares after cost of living
Select a city above to compare purchasing power
2019 BLS Actual
$80,250
2025 BLS Actual
$100,840
2026 Current Est.
$103,321
2019–2027 Growth
+31.9%
Salary Trajectory for Physical Therapists in Tulsa (2019–2027)
2019–2025: actual BLS OEWS data for this metro area. 2026+: CAGR 2.46% projection.
| Year | Annual Salary | Status |
|---|---|---|
| 2019 | $80,250 | Actual |
| 2020 | $85,730 | Actual |
| 2021 | $79,170 | Actual |
| 2022 | $92,450 | Actual |
| 2023 | $92,260 | Actual |
| 2024 | $99,650 | Actual |
| 2025 | $100,840 | Actual |
| 2026(current) | $103,321 | Estimated |
| 2027 | $105,862 | Projected |
Based on 7 years of BLS OEWS data for the Tulsa metropolitan area, the median physical therapist salary grew 25.7% from $80,250 (2019) to $100,840 (2025). At a 2.46% compound annual growth rate, salaries are projected to reach $105,862 by 2027 — a total increase of $25,612 (31.92%) from 2019.
Note: Historical values (2019–2025) are actual BLS OEWS figures for the Tulsa metropolitan area, sourced from annual Occupational Employment and Wage Statistics surveys. 2026–2026 figures are current estimates, and 2027 values are projections, calculated using a 2.46% CAGR derived from 7-year BLS historical data. Actual salaries may vary based on employer, experience, certifications, and local market conditions.
Salary by Experience Level
| Experience | Estimated Salary Range |
|---|---|
| 0-2 years (New Graduate) | $76,620 – $79,960 |
| 3-5 years (Mid Career) | $79,960 – $103,321 |
| 5+ years (Experienced) | $103,321 – $119,530 |
| 10+ years (Top Earner) | $119,530 – $130,647 |
PT salary ranges estimated from BLS percentile data. Individual physical therapist compensation varies by employer, certifications, and specialization.
Physical Therapist Job Market in Tulsa
As of now, Tulsa employs around 710 physical therapists, showcasing a stable job market despite evolving payment structures and industry pressures. The cost of living index in Tulsa stands at 89.214, which is below the national average, potentially enhancing the purchasing power of therapists in the area. Employers such as Athletico and Select Medical often provide competitive pay; however, those working in outpatient clinics may find their salaries influenced by productivity bonuses tied to the number of patient visits. The spread in physical therapist pay in Tulsa stems from various factors including board certifications that can command stipends, variations between insurance-based practices and cash-pay models, and the niche of the facility. For those looking to maximize their salary, obtaining specialty certifications such as OCS or SCS and considering roles in home health or travel PT positions could parse out lucrative opportunities in this evolving market.
More salary data for Tulsa, OK:
Frequently Asked Questions
How much do physical therapists make in Tulsa, OK in 2026?
Is Tulsa, OK a good place to work as a physical therapist?
Can physical therapists make $100K in Tulsa?
What is the cost-of-living adjusted physical therapist salary in Tulsa?
How much does a physical therapist make per hour in Tulsa?
Related Pages
Compare Salaries
Career Resources
Nearby Cities in Oklahoma
Written by Alex Morgan, DPT
Career Analyst
Alex Morgan has over 10 years of experience in physical therapy. They specialize in orthopedic rehabilitation. Alex works in a private practice setting.
Methodology & Data Source
Salary figures on this page are 2026 projections based on the Bureau of Labor Statistics Occupational Employment and Wage Statistics (OEWS) survey, May 2026 release. The BLS reported a median annual salary of $100,840 for physical therapistsin the Tulsa metropolitan area. A 2.46% compound annual growth rate (CAGR), calculated from 6-year national BLS wage trends, was applied to project current 2026 compensation. Percentile ranges (P10–P90) represent the full salary distribution across experience levels and practice settings in this market.
Data Sources & Methodology
Source: BLS, OEWS, 7-year dataset (–). Per-city data from annual BLS metropolitan area surveys.
2026 figures are projected from 2025 BLS data using a compound annual growth rate (CAGR) of 2.46%, derived from historical BLS wage trends for physical therapists (SOC 29-1123).
Compiled and verified by Alex Morgan, DPT, a licensed physical therapist with 10+ years of clinical experience. · View source data at BLS.gov