Physical Therapist Salary in Tigard, OR: $101,312 (2026)
Quick Answer:A full-time physical therapist in Tigard, OR earns a median $101,312/year (≈ $48.71/hour) in nominal terms for 2026 — projected from BLS OEWS 2025 (SOC 29-1123). Once you factor in Tigard's price level (3% above national, BEA RPP 102.6), that paycheck buys what $98,745 would nationally. Nominal pay sits 2.8% below the Oregon state average.
Based on BLS state-level estimates · View source
The physical therapist salary in Tigard, Oregon, reflects the dynamics of the local healthcare market, with a median annual income projected at $101,312 for 2026. This salary signifies a competitive position when compared to the national average of $105,288, displaying a slight gap in compensation. With a salary range from $77,461 at the 10th percentile to $132,029 at the 90th percentile, the earning potential varies significantly depending on the type of facility. Outpatient chains, while facing challenges such as lower base salaries, often compensate with productivity bonuses, affecting overall pay. The choice between working in outpatient clinics versus hospital settings can greatly influence compensation, making it essential for prospective physical therapists to consider the structural and financial implications of their employment decisions in Tigard.
About the Tigard Market
Salary estimated from Oregon average ($98,000) adjusted for local cost of living.
Salary Breakdown
| Percentile | Annual | Hourly |
|---|---|---|
| Entry Level (P10) | $77,461 | $37.24 |
| Lower Range (P25) | $85,320 | $41.01 |
| Median (P50)(typical) | $101,312 | $48.71 |
| Upper Range (P75) | $119,410 | $57.41 |
| Top Earners (P90) | $132,029 | $63.47 |
Median Salary Position
3.78% below the national average
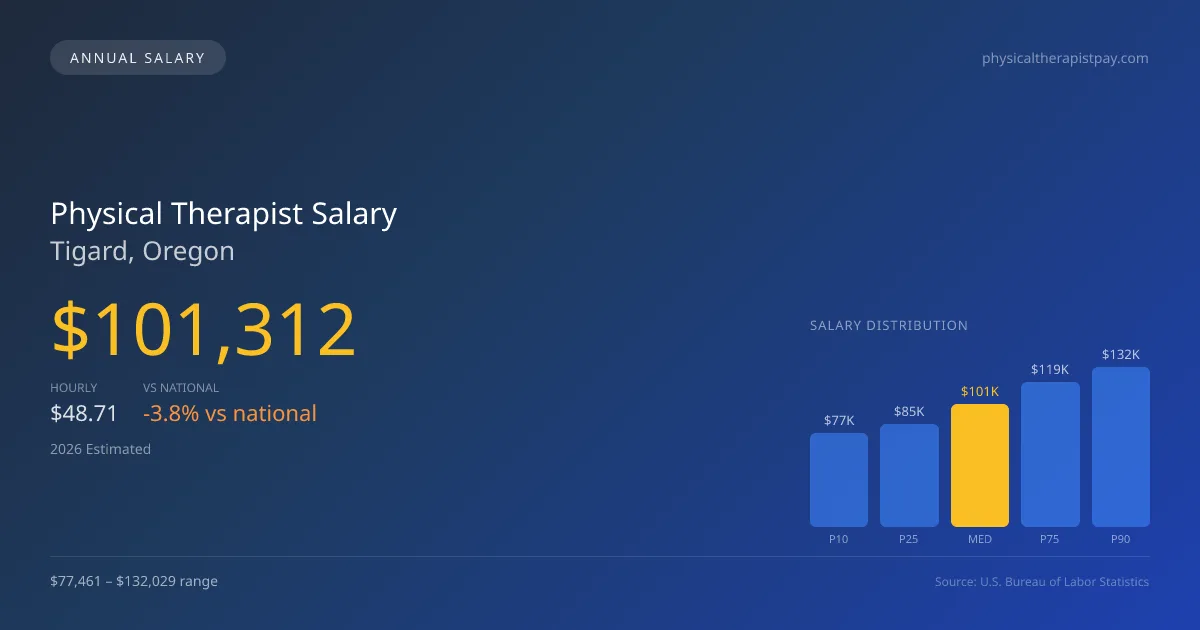
2026 Salary Percentile Distribution in Tigard
In Tigard, OR, the physical therapist salary spread from the 10th to 90th percentile is $54,568 (2026 est.). At $101,312, the local median is 3.78% below the national median of $105,288.
Salary Calculator
At 40 hours/week in Tigard: You'd be in the lower-middle range
How Tigard Physical Therapist Pay Compares
Tigard median: $101,312/year (2026)
| Compared To | Median Salary | Tigard Pays |
|---|---|---|
| Oregon Average | $104,231 | -2.80% less |
| National Average | $105,288 | -3.78% less |
Physical Therapists in Tigard, OR earn a median of $101,312 per year (2026 est.), which is 3.78% lower than the national median of $105,288 and 2.80% below the Oregon state average of $104,231.
Cost-of-Living Adjusted Salary
Tigard has a cost of living 2.60% above the national average.
Adjusted salary = nominal × (100 / CoL index). CoL index: 100 = national average.
Tigard, OR has a cost-of-living index of 102.6 (above the national average of 100). While the nominal salary of $101,312 is competitive, the higher cost of living reduces purchasing power to an effective $98,745 — a 2.53% reduction.
Compare Purchasing Power
Select a city to see how your salary compares after cost of living
Select a city above to compare purchasing power
2019 BLS Actual
$86,063
2025 BLS Actual
$98,880
2026 Current Est.
$101,312
2019–2027 Growth
+20.6%
Salary Trajectory for Physical Therapists in Tigard (2019–2027)
2019–2025: actual BLS OEWS data for this metro area. 2026+: CAGR 2.46% projection.
| Year | Annual Salary | Status |
|---|---|---|
| 2019 | $86,063 | Actual |
| 2020 | $87,574 | Actual |
| 2021 | $92,010 | Actual |
| 2022 | $94,030 | Actual |
| 2023 | $95,945 | Actual |
| 2024 | $97,755 | Actual |
| 2025 | $98,880 | Actual |
| 2026(current) | $101,312 | Estimated |
| 2027 | $103,805 | Projected |
Based on 7 years of BLS OEWS data for the Tigard metropolitan area, the median physical therapist salary grew 14.9% from $86,063 (2019) to $98,880 (2025). At a 2.46% compound annual growth rate, salaries are projected to reach $103,805 by 2027 — a total increase of $17,742 (20.62%) from 2019.
Note: Historical values (2019–2025) are actual BLS OEWS figures for the Tigard metropolitan area, sourced from annual Occupational Employment and Wage Statistics surveys. 2026–2026 figures are current estimates, and 2027 values are projections, calculated using a 2.46% CAGR derived from 7-year BLS historical data. Actual salaries may vary based on employer, experience, certifications, and local market conditions.
Salary by Experience Level
| Experience | Estimated Salary Range |
|---|---|
| 0-2 years (New Graduate) | $77,461 – $85,320 |
| 3-5 years (Mid Career) | $85,320 – $101,312 |
| 5+ years (Experienced) | $101,312 – $119,410 |
| 10+ years (Top Earner) | $119,410 – $132,029 |
PT salary ranges estimated from BLS percentile data. Individual physical therapist compensation varies by employer, certifications, and specialization.
Physical Therapist Job Market in Tigard
Analyzing the job market, Tigard employs nine physical therapists, indicating a competitive yet manageable landscape for new graduates and experienced professionals alike. The cost of living index at 102.6 suggests that while salaries are reasonable, purchasing power is slightly above the national average. Among local employers, outpatient orthopedic clinics, especially larger chains like ATI and Athletico, tend to offer competitive pay structures, while hospital systems may provide higher base salaries alongside comprehensive benefits. Factors that contribute to the disparity in salaries include productivity expectations, opportunities for board certification stipends, and the cash-pay versus insurance practice models. To maximize earnings in Tigard, new physical therapists should focus on enhancing their productivity metrics and considering board specialization, like obtaining OCS or SCS certifications, as these credentials can significantly influence pay rates and job opportunities in the area.
More salary data for Tigard, OR:
Frequently Asked Questions
How much do physical therapists make in Tigard, OR in 2026?
Is Tigard, OR a good place to work as a physical therapist?
Can physical therapists make $100K in Tigard?
What is the cost-of-living adjusted physical therapist salary in Tigard?
How much does a physical therapist make per hour in Tigard?
Related Pages
Compare Salaries
Career Resources
Nearby Cities in Oregon
Written by Alex Morgan, DPT
Career Analyst
Alex Morgan has over 10 years of experience in physical therapy. They specialize in orthopedic rehabilitation. Alex works in a private practice setting.
Methodology & Data Source
Salary figures on this page are 2026 projections based on the Bureau of Labor Statistics Occupational Employment and Wage Statistics (OEWS) survey, May 2026 release. The BLS reported a median annual salary of $98,880 for physical therapistsin the Tigard metropolitan area. A 2.46% compound annual growth rate (CAGR), calculated from 6-year national BLS wage trends, was applied to project current 2026 compensation. Percentile ranges (P10–P90) represent the full salary distribution across experience levels and practice settings in this market.
Data Sources & Methodology
Salary data for Tigard is estimated from official BLS state-level occupational wage data (2025), adjusted for regional cost-of-living differences using BEA RPP (Regional Price Parities).
2026 figures are projected from 2025 BLS data using a compound annual growth rate (CAGR) of 2.46%, derived from historical BLS wage trends for physical therapists (SOC 29-1123).
Compiled and verified by Alex Morgan, DPT, a licensed physical therapist with 10+ years of clinical experience. · View source data at BLS.gov