Physical Therapist Salary in Ponce, PR: $60,267 (2026)
Quick Answer:A full-time physical therapist in Ponce, PR earns a median $60,267/year (≈ $28.98/hour) in nominal terms for 2026 — projected from BLS OEWS 2025 (SOC 29-1123). Once you factor in Puerto Rico's price level (25% below national, BEA RPP 75.0), that paycheck buys what $80,356 would nationally. Nominal pay sits 0.9% below the Puerto Rico state average.
Official BLS data · View source
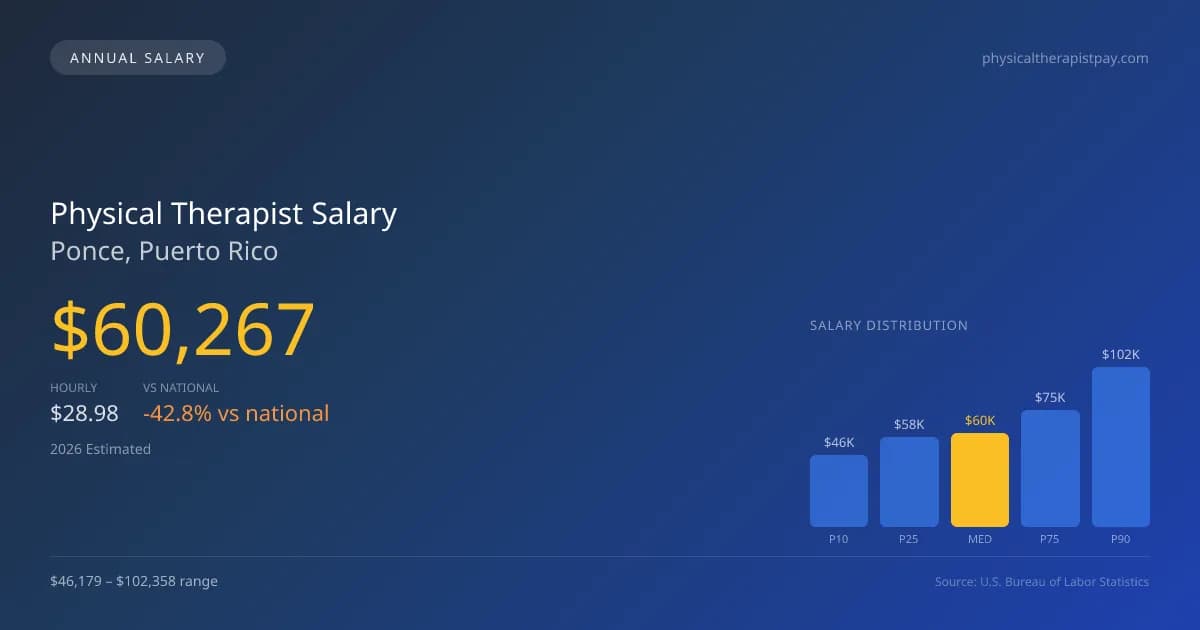
In terms of compensation, physical therapists in Ponce, Puerto Rico can expect a median annual salary of $60,267, which significantly lags behind the national median of $105,288. The local salary range spans from $46,179 at the 10th percentile to $102,358 at the 90th percentile, reflecting the varied levels of experience and productivity expectations. This data, derived from official Bureau of Labor Statistics (BLS) OEWS surveys and projected for 2026, portrays a market that may challenge emerging professionals due to its lower earnings potential compared to many mainland U.S. locations. However, with a steady growth rate of 2.46% projected over the next five years, opportunities exist for those who are strategic about their career paths and skill development.
Salary Breakdown
| Percentile | Annual | Hourly |
|---|---|---|
| Entry Level (P10) | $46,179 | $22.20 |
| Lower Range (P25) | $57,695 | $27.74 |
| Median (P50)(typical) | $60,267 | $28.98 |
| Upper Range (P75) | $74,591 | $35.86 |
| Top Earners (P90) | $102,358 | $49.21 |
Median Salary Position
42.76% below the national average
2026 Salary Percentile Distribution in Ponce
In Ponce, PR, the physical therapist salary spread from the 10th to 90th percentile is $56,179 (2026 est.). At $60,267, the local median is 42.76% below the national median of $105,288.
Salary Calculator
At 40 hours/week in Ponce: You'd be in the lower-middle range
How Ponce Physical Therapist Pay Compares
Ponce median: $60,267/year (2026)
| Compared To | Median Salary | Ponce Pays |
|---|---|---|
| Puerto Rico Average | $60,814 | -0.90% less |
| National Average | $105,288 | -42.76% less |
Physical Therapists in Ponce, PR earn a median of $60,267 per year (2026 est.), which is 42.76% lower than the national median of $105,288 and 0.90% below the Puerto Rico state average of $60,814.
2019 BLS Actual
$32,160
2025 BLS Actual
$58,820
2026 Current Est.
$60,267
2019–2027 Growth
+92.0%
Salary Trajectory for Physical Therapists in Ponce (2019–2027)
2019–2025: actual BLS OEWS data for this metro area. 2026+: CAGR 2.46% projection.
| Year | Annual Salary | Status |
|---|---|---|
| 2019 | $32,160 | Actual |
| 2020 | $44,860 | Actual |
| 2021 | $36,830 | Actual |
| 2022 | $44,940 | Actual |
| 2023 | $51,850 | Actual |
| 2024 | $54,340 | Actual |
| 2025 | $58,820 | Actual |
| 2026(current) | $60,267 | Estimated |
| 2027 | $61,750 | Projected |
Based on 7 years of BLS OEWS data for the Ponce metropolitan area, the median physical therapist salary grew 82.9% from $32,160 (2019) to $58,820 (2025). At a 2.46% compound annual growth rate, salaries are projected to reach $61,750 by 2027 — a total increase of $29,590 (92.01%) from 2019.
Note: Historical values (2019–2025) are actual BLS OEWS figures for the Ponce metropolitan area, sourced from annual Occupational Employment and Wage Statistics surveys. 2026–2026 figures are current estimates, and 2027 values are projections, calculated using a 2.46% CAGR derived from 7-year BLS historical data. Actual salaries may vary based on employer, experience, certifications, and local market conditions.
Salary by Experience Level
| Experience | Estimated Salary Range |
|---|---|
| 0-2 years (New Graduate) | $46,179 – $57,695 |
| 3-5 years (Mid Career) | $57,695 – $60,267 |
| 5+ years (Experienced) | $60,267 – $74,591 |
| 10+ years (Top Earner) | $74,591 – $102,358 |
PT salary ranges estimated from BLS percentile data. Individual physical therapist compensation varies by employer, certifications, and specialization.
Physical Therapist Job Market in Ponce
In exploring the local job market, the area employs around 40 physical therapists, making it a specialized yet competitive environment. Factors such as living costs in Ponce affect the real earnings power, urging therapists to seek positions in higher-paying sectors. Outpatient orthopedic clinics often offer salaries competitive with hospital systems, and practitioners with advanced board certifications like OCS or SCS can enhance their earning potential. The disparity in pay is largely driven by productivity expectations, which are defined by units per visit and number of visits per day. Therapists looking to maximize pay might consider aligning with cash-pay models or working in specialized settings such as sports medicine clinics, where reimbursement may be higher. Understanding these dynamics is essential for those navigating physical therapist pay in Ponce, PR.
More salary data for Ponce, PR:
Frequently Asked Questions
How much do physical therapists make in Ponce, PR in 2026?
Is Ponce, PR a good place to work as a physical therapist?
Can physical therapists make $100K in Ponce?
Do physical therapists make good money in Ponce?
How much does a physical therapist make per hour in Ponce?
Related Pages
Compare Salaries
Career Resources
Nearby Cities in Puerto Rico
Written by Alex Morgan, DPT
Career Analyst
Alex Morgan has over 10 years of experience in physical therapy. They specialize in orthopedic rehabilitation. Alex works in a private practice setting.
Methodology & Data Source
Salary figures on this page are 2026 projections based on the Bureau of Labor Statistics Occupational Employment and Wage Statistics (OEWS) survey, May 2026 release. The BLS reported a median annual salary of $58,820 for physical therapistsin the Ponce metropolitan area. A 2.46% compound annual growth rate (CAGR), calculated from 6-year national BLS wage trends, was applied to project current 2026 compensation. Percentile ranges (P10–P90) represent the full salary distribution across experience levels and practice settings in this market.
Data Sources & Methodology
Source: BLS, OEWS, 7-year dataset (–). Per-city data from annual BLS metropolitan area surveys.
2026 figures are projected from 2025 BLS data using a compound annual growth rate (CAGR) of 2.46%, derived from historical BLS wage trends for physical therapists (SOC 29-1123).
Compiled and verified by Alex Morgan, DPT, a licensed physical therapist with 10+ years of clinical experience. · View source data at BLS.gov