Physical Therapist Salary in Spartanburg, SC: $114,612 (2026)
Quick Answer:A full-time physical therapist in Spartanburg, SC earns a median $114,612/year (≈ $55.10/hour) in nominal terms for 2026 — projected from BLS OEWS 2025 (SOC 29-1123). Once you factor in Spartanburg's price level (9% below national, BEA RPP 91.1), that paycheck buys what $125,877 would nationally. Nominal pay sits 10.4% above the South Carolina state average.
Official BLS data · View source
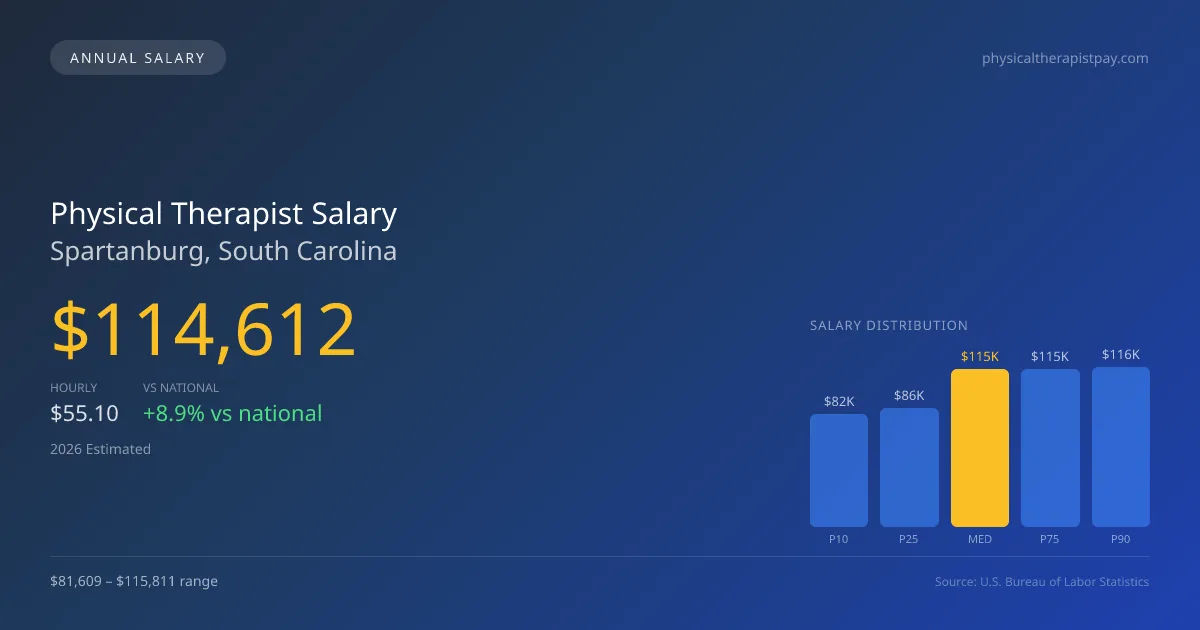
In Spartanburg, South Carolina, physical therapists are positioned to earn a median annual salary of $114,612 in 2026, reflecting a competitive edge over the national median of $105,288 for the same year. Salary ranges are diverse, with the lowest 10% earning around $81,609 while the top 90% can make up to $115,811. This data, derived from the official Bureau of Labor Statistics (BLS) Occupational Employment and Wage Statistics, highlights the influence of practice settings on compensation. Physical therapists employed in outpatient settings often face differing pay scales compared to their hospital or skilled nursing facility counterparts, which can impact their overall earnings and job satisfaction in Spartanburg’s evolving healthcare market.
Salary Breakdown
| Percentile | Annual | Hourly |
|---|---|---|
| Entry Level (P10) | $81,609 | $39.23 |
| Lower Range (P25) | $86,261 | $41.48 |
| Median (P50)(typical) | $114,612 | $55.10 |
| Upper Range (P75) | $114,612 | $55.10 |
| Top Earners (P90) | $115,811 | $55.68 |
Median Salary Position
8.86% above the national average
2026 Salary Percentile Distribution in Spartanburg
In Spartanburg, SC, the physical therapist salary spread from the 10th to 90th percentile is $34,202 (2026 est.). At $114,612, the local median is 8.86% above the national median of $105,288.
Salary Calculator
At 40 hours/week in Spartanburg: You'd be in the top 10% of earners
How Spartanburg Physical Therapist Pay Compares
Spartanburg median: $114,612/year (2026)
| Compared To | Median Salary | Spartanburg Pays |
|---|---|---|
| South Carolina Average | $103,815 | +10.40% more |
| National Average | $105,288 | +8.86% more |
Physical Therapists in Spartanburg, SC earn a median of $114,612 per year (2026 est.), which is 8.86% higher than the national median of $105,288 and 10.40% above the South Carolina state average of $103,815.
Cost-of-Living Adjusted Salary
Spartanburg has a cost of living 8.95% below the national average, meaning your salary goes further here.
Adjusted salary = nominal × (100 / CoL index). CoL index: 100 = national average.
Spartanburg, SC has a cost-of-living index of 91.051 (below the national average of 100). A physical therapist earning $114,612 nominally has purchasing power equivalent to $125,877 in an average-cost city — an effective 9.83% boost.
Compare Purchasing Power
Select a city to see how your salary compares after cost of living
Select a city above to compare purchasing power
2019 BLS Actual
$90,060
2025 BLS Actual
$111,860
2026 Current Est.
$114,612
2019–2027 Growth
+30.4%
Salary Trajectory for Physical Therapists in Spartanburg (2019–2027)
2019–2025: actual BLS OEWS data for this metro area. 2026+: CAGR 2.46% projection.
| Year | Annual Salary | Status |
|---|---|---|
| 2019 | $90,060 | Actual |
| 2020 | $87,180 | Actual |
| 2021 | $81,250 | Actual |
| 2022 | $97,480 | Actual |
| 2023 | $103,850 | Actual |
| 2024 | $108,040 | Actual |
| 2025 | $111,860 | Actual |
| 2026(current) | $114,612 | Estimated |
| 2027 | $117,431 | Projected |
Based on 7 years of BLS OEWS data for the Spartanburg metropolitan area, the median physical therapist salary grew 24.2% from $90,060 (2019) to $111,860 (2025). At a 2.46% compound annual growth rate, salaries are projected to reach $117,431 by 2027 — a total increase of $27,371 (30.39%) from 2019.
Note: Historical values (2019–2025) are actual BLS OEWS figures for the Spartanburg metropolitan area, sourced from annual Occupational Employment and Wage Statistics surveys. 2026–2026 figures are current estimates, and 2027 values are projections, calculated using a 2.46% CAGR derived from 7-year BLS historical data. Actual salaries may vary based on employer, experience, certifications, and local market conditions.
Salary by Experience Level
| Experience | Estimated Salary Range |
|---|---|
| 0-2 years (New Graduate) | $81,609 – $86,261 |
| 3-5 years (Mid Career) | $86,261 – $114,612 |
| 5+ years (Experienced) | $114,612 – $114,612 |
| 10+ years (Top Earner) | $114,612 – $115,811 |
PT salary ranges estimated from BLS percentile data. Individual physical therapist compensation varies by employer, certifications, and specialization.
Physical Therapist Job Market in Spartanburg
Spartanburg's physical therapy job market employs about 350 professionals, indicating moderate demand for these practitioners. With a cost of living index of 91.051, the affordability of life in this area enhances the take-home purchasing power of physical therapists compared to many other regions. Outpatient orthopedic clinics, particularly chains like ATI and Athletico, tend to offer lower initial salaries than hospital systems but may provide performance bonuses that align with productivity expectations. Factors such as specialty board certifications can also lead to higher pay, especially when paired with clinic ownership opportunities or a preference for cash-pay models. To maximize earnings in Spartanburg, physical therapists should consider obtaining specialized credentials, maintaining a high productivity level, and exploring diverse employment opportunities, including travel positions that often come with higher pay premiums.
More salary data for Spartanburg, SC:
Frequently Asked Questions
How much do physical therapists make in Spartanburg, SC in 2026?
Is Spartanburg, SC a good place to work as a physical therapist?
Can physical therapists make $100K in Spartanburg?
What is the cost-of-living adjusted physical therapist salary in Spartanburg?
How much does a physical therapist make per hour in Spartanburg?
Related Pages
Compare Salaries
Career Resources
Nearby Cities in South Carolina
Written by Alex Morgan, DPT
Career Analyst
Alex Morgan has over 10 years of experience in physical therapy. They specialize in orthopedic rehabilitation. Alex works in a private practice setting.
Methodology & Data Source
Salary figures on this page are 2026 projections based on the Bureau of Labor Statistics Occupational Employment and Wage Statistics (OEWS) survey, May 2026 release. The BLS reported a median annual salary of $111,860 for physical therapistsin the Spartanburg metropolitan area. A 2.46% compound annual growth rate (CAGR), calculated from 6-year national BLS wage trends, was applied to project current 2026 compensation. Percentile ranges (P10–P90) represent the full salary distribution across experience levels and practice settings in this market.
Data Sources & Methodology
Source: BLS, OEWS, 7-year dataset (–). Per-city data from annual BLS metropolitan area surveys.
2026 figures are projected from 2025 BLS data using a compound annual growth rate (CAGR) of 2.46%, derived from historical BLS wage trends for physical therapists (SOC 29-1123).
Compiled and verified by Alex Morgan, DPT, a licensed physical therapist with 10+ years of clinical experience. · View source data at BLS.gov