Physical Therapist Salary in Rapid City, SD: $96,435 (2026)
Quick Answer:A full-time physical therapist in Rapid City, SD earns a median $96,435/year (≈ $46.36/hour) in nominal terms for 2026 — projected from BLS OEWS 2025 (SOC 29-1123). Once you factor in Rapid City's price level (11% below national, BEA RPP 89.2), that paycheck buys what $108,159 would nationally. Nominal pay sits 1.3% below the South Dakota state average.
Official BLS data · View source
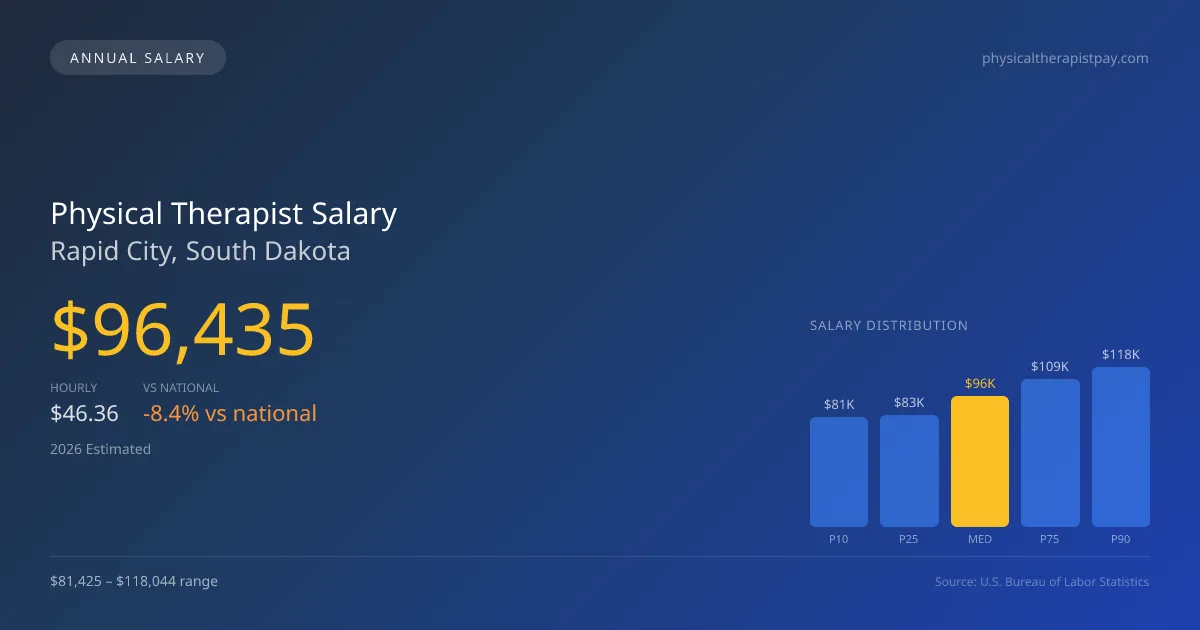
In 2026, physical therapist salaries in Rapid City, South Dakota, are projected to reach a median of $96,435, slightly below the national median of $105,288. The salary range spans from $81,425 at the 10th percentile to $118,044 at the 90th percentile, reflecting the variety of employment settings. Physical therapists in Rapid City often find opportunities in outpatient clinics, hospitals, and skilled nursing facilities, with each environment influencing compensation structures. Outpatient chains may offer lower starting salaries but often include bonuses for productivity, while hospital systems might provide slightly higher pay alongside benefits packages. These figures are based on 2025 BLS OEWS data, projected to 2026, emphasizing the nuanced job market that favors certain employment models.
Salary Breakdown
| Percentile | Annual | Hourly |
|---|---|---|
| Entry Level (P10) | $81,425 | $39.15 |
| Lower Range (P25) | $82,511 | $39.67 |
| Median (P50)(typical) | $96,435 | $46.36 |
| Upper Range (P75) | $109,099 | $52.45 |
| Top Earners (P90) | $118,044 | $56.75 |
Median Salary Position
8.41% below the national average
2026 Salary Percentile Distribution in Rapid City
In Rapid City, SD, the physical therapist salary spread from the 10th to 90th percentile is $36,619 (2026 est.). At $96,435, the local median is 8.41% below the national median of $105,288.
Salary Calculator
At 40 hours/week in Rapid City: You'd be in the lower-middle range
How Rapid City Physical Therapist Pay Compares
Rapid City median: $96,435/year (2026)
| Compared To | Median Salary | Rapid City Pays |
|---|---|---|
| South Dakota Average | $97,706 | -1.30% less |
| National Average | $105,288 | -8.41% less |
Physical Therapists in Rapid City, SD earn a median of $96,435 per year (2026 est.), which is 8.41% lower than the national median of $105,288 and 1.30% below the South Dakota state average of $97,706.
Cost-of-Living Adjusted Salary
Rapid City has a cost of living 10.84% below the national average, meaning your salary goes further here.
Adjusted salary = nominal × (100 / CoL index). CoL index: 100 = national average.
Rapid City, SD has a cost-of-living index of 89.16 (below the national average of 100). A physical therapist earning $96,435 nominally has purchasing power equivalent to $108,159 in an average-cost city — an effective 12.16% boost.
Compare Purchasing Power
Select a city to see how your salary compares after cost of living
Select a city above to compare purchasing power
2019 BLS Actual
$80,400
2025 BLS Actual
$94,120
2026 Current Est.
$96,435
2019–2027 Growth
+22.9%
Salary Trajectory for Physical Therapists in Rapid City (2019–2027)
2019–2025: actual BLS OEWS data for this metro area. 2026+: CAGR 2.46% projection.
| Year | Annual Salary | Status |
|---|---|---|
| 2019 | $80,400 | Actual |
| 2020 | $84,260 | Actual |
| 2021 | $92,980 | Actual |
| 2022 | $83,530 | Actual |
| 2023 | $88,770 | Actual |
| 2024 | $92,290 | Actual |
| 2025 | $94,120 | Actual |
| 2026(current) | $96,435 | Estimated |
| 2027 | $98,808 | Projected |
Based on 7 years of BLS OEWS data for the Rapid City metropolitan area, the median physical therapist salary grew 17.1% from $80,400 (2019) to $94,120 (2025). At a 2.46% compound annual growth rate, salaries are projected to reach $98,808 by 2027 — a total increase of $18,408 (22.90%) from 2019.
Note: Historical values (2019–2025) are actual BLS OEWS figures for the Rapid City metropolitan area, sourced from annual Occupational Employment and Wage Statistics surveys. 2026–2026 figures are current estimates, and 2027 values are projections, calculated using a 2.46% CAGR derived from 7-year BLS historical data. Actual salaries may vary based on employer, experience, certifications, and local market conditions.
Salary by Experience Level
| Experience | Estimated Salary Range |
|---|---|
| 0-2 years (New Graduate) | $81,425 – $82,511 |
| 3-5 years (Mid Career) | $82,511 – $96,435 |
| 5+ years (Experienced) | $96,435 – $109,099 |
| 10+ years (Top Earner) | $109,099 – $118,044 |
PT salary ranges estimated from BLS percentile data. Individual physical therapist compensation varies by employer, certifications, and specialization.
Physical Therapist Job Market in Rapid City
Currently, there are about 190 physical therapists practicing in Rapid City, indicating a stable local job market despite competitive salary figures. With a cost of living index of 89.16, the relative affordability of living in Rapid City enhances take-home pay, although it still necessitates strategic planning for financial growth. Employers such as outpatient orthopedic clinics and hospital systems contribute to a disparity in earnings, where factors like productivity requirements, board certification stipends, and clinic ownership flexibility significantly influence salaries. Maximizing pay in this region could involve pursuing board specialization (like OCS or SCS), opting for cash-pay models, or considering travel PT opportunities that can offer substantial premiums. By understanding the local dynamics of physical therapist pay in Rapid City, candidates can better position themselves for success in this evolving field.
More salary data for Rapid City, SD:
Frequently Asked Questions
How much do physical therapists make in Rapid City, SD in 2026?
Is Rapid City, SD a good place to work as a physical therapist?
Can physical therapists make $100K in Rapid City?
What is the cost-of-living adjusted physical therapist salary in Rapid City?
How much does a physical therapist make per hour in Rapid City?
Related Pages
Compare Salaries
Career Resources
Nearby Cities in South Dakota
Written by Alex Morgan, DPT
Career Analyst
Alex Morgan has over 10 years of experience in physical therapy. They specialize in orthopedic rehabilitation. Alex works in a private practice setting.
Methodology & Data Source
Salary figures on this page are 2026 projections based on the Bureau of Labor Statistics Occupational Employment and Wage Statistics (OEWS) survey, May 2026 release. The BLS reported a median annual salary of $94,120 for physical therapistsin the Rapid City metropolitan area. A 2.46% compound annual growth rate (CAGR), calculated from 6-year national BLS wage trends, was applied to project current 2026 compensation. Percentile ranges (P10–P90) represent the full salary distribution across experience levels and practice settings in this market.
Data Sources & Methodology
Source: BLS, OEWS, 7-year dataset (–). Per-city data from annual BLS metropolitan area surveys.
2026 figures are projected from 2025 BLS data using a compound annual growth rate (CAGR) of 2.46%, derived from historical BLS wage trends for physical therapists (SOC 29-1123).
Compiled and verified by Alex Morgan, DPT, a licensed physical therapist with 10+ years of clinical experience. · View source data at BLS.gov