Physical Therapist Salary in Knoxville, TN: $98,474 (2026)
Quick Answer:A full-time physical therapist in Knoxville, TN earns a median $98,474/year (≈ $47.35/hour) in nominal terms for 2026 — projected from BLS OEWS 2025 (SOC 29-1123). Once you factor in Knoxville's price level (7% below national, BEA RPP 92.6), that paycheck buys what $106,379 would nationally. Nominal pay sits 1.4% below the Tennessee state average.
Official BLS data · View source
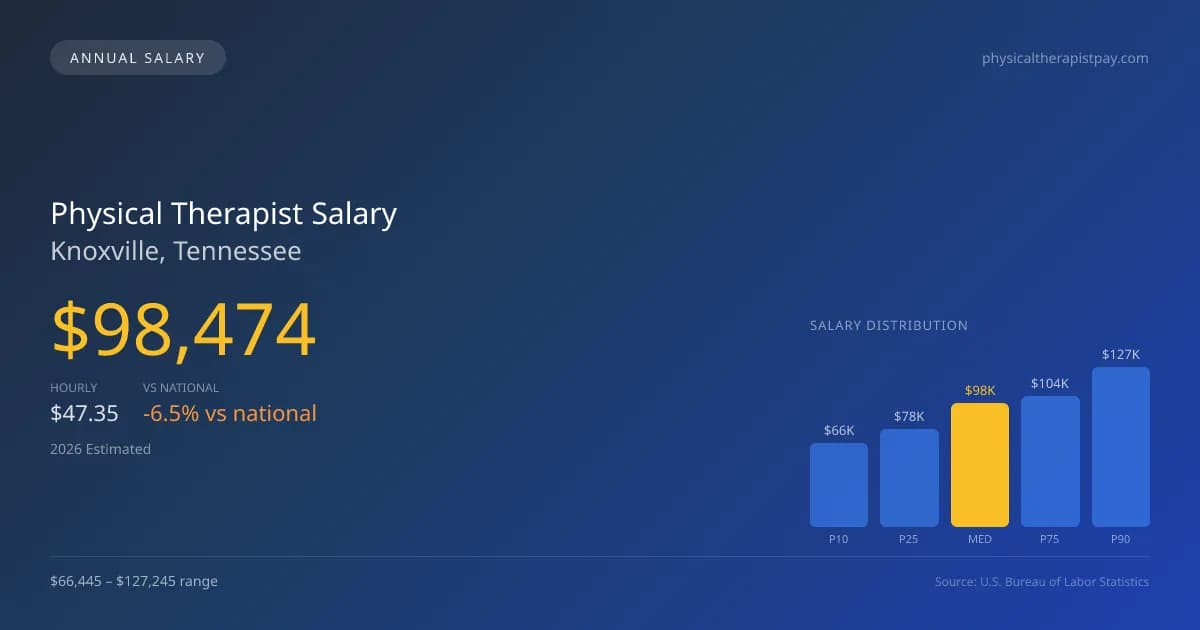
Within the context of Knoxville, Tennessee, the projected median annual compensation for physical therapists in 2026 is set at $98,474, which is slightly lower than the national median of $105,288. This salary figure reflects a range of earnings from $66,445 at the 10th percentile up to $127,245 at the 90th percentile. Notably, the compensation landscape for physical therapists in Knoxville varies depending on the type of facility. Outpatient clinics, which have become increasingly prevalent, often offer lower base salaries compared to hospitals or skilled nursing facilities but might incorporate productivity bonuses that can enhance overall pay. This structural choice directly influences how much physical therapists make in Knoxville and highlights the competitive dynamics in the local job market, all based on 2025 BLS OEWS data, projected to 2026.
Salary Breakdown
| Percentile | Annual | Hourly |
|---|---|---|
| Entry Level (P10) | $66,445 | $31.95 |
| Lower Range (P25) | $77,818 | $37.42 |
| Median (P50)(typical) | $98,474 | $47.35 |
| Upper Range (P75) | $104,007 | $50.00 |
| Top Earners (P90) | $127,245 | $61.18 |
Median Salary Position
6.47% below the national average
2026 Salary Percentile Distribution in Knoxville
In Knoxville, TN, the physical therapist salary spread from the 10th to 90th percentile is $60,800 (2026 est.). At $98,474, the local median is 6.47% below the national median of $105,288.
Salary Calculator
At 40 hours/week in Knoxville: You'd be above the median
How Knoxville Physical Therapist Pay Compares
Knoxville median: $98,474/year (2026)
| Compared To | Median Salary | Knoxville Pays |
|---|---|---|
| Tennessee Average | $99,873 | -1.40% less |
| National Average | $105,288 | -6.47% less |
Physical Therapists in Knoxville, TN earn a median of $98,474 per year (2026 est.), which is 6.47% lower than the national median of $105,288 and 1.40% below the Tennessee state average of $99,873.
Cost-of-Living Adjusted Salary
Knoxville has a cost of living 7.43% below the national average, meaning your salary goes further here.
Adjusted salary = nominal × (100 / CoL index). CoL index: 100 = national average.
Knoxville, TN has a cost-of-living index of 92.569 (below the national average of 100). A physical therapist earning $98,474 nominally has purchasing power equivalent to $106,379 in an average-cost city — an effective 8.03% boost.
Compare Purchasing Power
Select a city to see how your salary compares after cost of living
Select a city above to compare purchasing power
2019 BLS Actual
$83,660
2025 BLS Actual
$96,110
2026 Current Est.
$98,474
2019–2027 Growth
+20.6%
Salary Trajectory for Physical Therapists in Knoxville (2019–2027)
2019–2025: actual BLS OEWS data for this metro area. 2026+: CAGR 2.46% projection.
| Year | Annual Salary | Status |
|---|---|---|
| 2019 | $83,660 | Actual |
| 2020 | $86,600 | Actual |
| 2021 | $83,020 | Actual |
| 2022 | $88,130 | Actual |
| 2023 | $95,980 | Actual |
| 2024 | $97,080 | Actual |
| 2025 | $96,110 | Actual |
| 2026(current) | $98,474 | Estimated |
| 2027 | $100,897 | Projected |
Based on 7 years of BLS OEWS data for the Knoxville metropolitan area, the median physical therapist salary grew 14.9% from $83,660 (2019) to $96,110 (2025). At a 2.46% compound annual growth rate, salaries are projected to reach $100,897 by 2027 — a total increase of $17,237 (20.60%) from 2019.
Note: Historical values (2019–2025) are actual BLS OEWS figures for the Knoxville metropolitan area, sourced from annual Occupational Employment and Wage Statistics surveys. 2026–2026 figures are current estimates, and 2027 values are projections, calculated using a 2.46% CAGR derived from 7-year BLS historical data. Actual salaries may vary based on employer, experience, certifications, and local market conditions.
Salary by Experience Level
| Experience | Estimated Salary Range |
|---|---|
| 0-2 years (New Graduate) | $66,445 – $77,818 |
| 3-5 years (Mid Career) | $77,818 – $98,474 |
| 5+ years (Experienced) | $98,474 – $104,007 |
| 10+ years (Top Earner) | $104,007 – $127,245 |
PT salary ranges estimated from BLS percentile data. Individual physical therapist compensation varies by employer, certifications, and specialization.
Physical Therapist Job Market in Knoxville
In Knoxville, there are currently around 590 physical therapists employed, indicating a solid market presence. The cost of living index sits at 92.569, suggesting that while salaries might trail the national average, the purchasing power for these earnings is relatively strong, allowing for a comfortable standard of living. Among local employers, outpatient orthopedic clinics like ATI and Athletico typically offer salaries below the hospital systems but often present opportunities for productivity-related pay incentives. The disparity between the lowest and highest earners is influenced by various factors, including board certification stipends, cash-pay models versus insurance reimbursements, and expectations for patient productivity. For those aiming to maximize physical therapist pay in Knoxville TN, pursuing specialization certifications such as OCS or SCS and considering transitioning to clinic ownership or cash-based practices could prove beneficial, aligning better with high-demand care models in today's evolving health care landscape.
More salary data for Knoxville, TN:
Frequently Asked Questions
How much do physical therapists make in Knoxville, TN in 2026?
Is Knoxville, TN a good place to work as a physical therapist?
Can physical therapists make $100K in Knoxville?
What is the cost-of-living adjusted physical therapist salary in Knoxville?
How much does a physical therapist make per hour in Knoxville?
Related Pages
Compare Salaries
Career Resources
Nearby Cities in Tennessee
Written by Alex Morgan, DPT
Career Analyst
Alex Morgan has over 10 years of experience in physical therapy. They specialize in orthopedic rehabilitation. Alex works in a private practice setting.
Methodology & Data Source
Salary figures on this page are 2026 projections based on the Bureau of Labor Statistics Occupational Employment and Wage Statistics (OEWS) survey, May 2026 release. The BLS reported a median annual salary of $96,110 for physical therapistsin the Knoxville metropolitan area. A 2.46% compound annual growth rate (CAGR), calculated from 6-year national BLS wage trends, was applied to project current 2026 compensation. Percentile ranges (P10–P90) represent the full salary distribution across experience levels and practice settings in this market.
Data Sources & Methodology
Source: BLS, OEWS, 7-year dataset (–). Per-city data from annual BLS metropolitan area surveys.
2026 figures are projected from 2025 BLS data using a compound annual growth rate (CAGR) of 2.46%, derived from historical BLS wage trends for physical therapists (SOC 29-1123).
Compiled and verified by Alex Morgan, DPT, a licensed physical therapist with 10+ years of clinical experience. · View source data at BLS.gov