Physical Therapist Salary in Utah: $102,914 (2026)
Quick Answer:Across Utah's 41 metropolitan areas, the average median physical therapist pay sits at $102,914/year heading into 2026 — a figure projected from 2025 BLS OEWS wage data for SOC 29-1123. Because Utah sits at BEA RPP 98.1 (2% below the U.S. baseline), that statewide median translates to roughly $104,907 in nationally-comparable purchasing power. Highest-paying metros: Murray ($104,276), Salt Lake City ($103,840), West Jordan ($100,759).
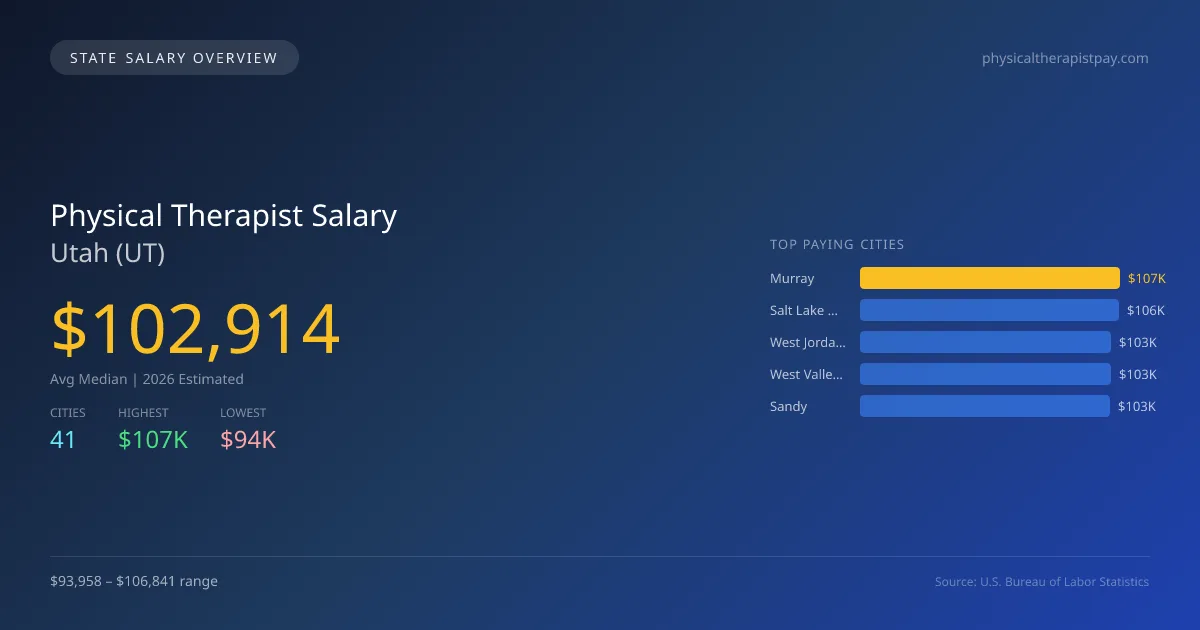
In Utah, physical therapist salaries average $102,914 in 2026, slightly below the national median of $105,288, reflecting a difference of 2.3%. The salary range among cities varies significantly; Murray offers the highest average salary at $106,841, while Clinton has the lowest at $93,958—a gap of $12,883. This discrepancy can be attributed to local demand for physical therapy services, cost of living variations, and competition among healthcare providers in different regions. Physical therapists in Utah must meet licensing requirements and adhere to state scope of practice laws, which influence job opportunities and salaries. The profession is expected to grow at an annual rate of 2.46%, driven by the increasing emphasis on healthcare, aging populations, and rising awareness of physical therapy benefits. Key cities for employment include Salt Lake City, at $106,394, West Jordan, at $103,238, West Valley City, at $103,073, and Sandy, at $102,867. The total number of employed physical therapists in the state stands at 2,504, reflecting a stable job market with a favorable outlook for new entrants into the field. As demand for services continues to rise, physical therapists in Utah can expect solid career prospects in the coming years.
Utah Physical Therapist Salary Range
Overall salary range in Utah: $58,986 (lowest entry-level) to $154,182 (highest top earner)
Utah vs National Average
Utah physical therapists earn 2.25% less than the national median ($-2,374/year difference).
Utah Physical Therapist Salary Distribution (2026)
Physical Therapist salaries in Utah range from $67,599 (entry-level, 10th percentile) to $139,015 (top earners, 90th percentile), with a median of $102,914. The Utah median is $2,374 below the US national median of $105,288. The average hourly rate is $49.48/hr. Approximately 2,504 physical therapists are employed across 41 cities.
2019 BLS Actual
$83,302
2025 BLS Actual
$100,443
2026 Current Est.
$102,914
2019–2027 Growth
+26.6%
Salary Trajectory for Physical Therapists in Utah (2019–2027)
2019–2025: actual BLS OEWS data for this metro area. 2026+: CAGR 2.46% projection.
| Year | Annual Salary | Status |
|---|---|---|
| 2019 | $83,302 | Actual |
| 2020 | $84,922 | Actual |
| 2021 | $84,090 | Actual |
| 2022 | $91,893 | Actual |
| 2023 | $96,531 | Actual |
| 2024 | $96,015 | Actual |
| 2025 | $100,443 | Actual |
| 2026(current) | $102,914 | Estimated |
| 2027 | $105,446 | Projected |
Based on 7 years of BLS OEWS data for the Utah metropolitan area, the median physical therapist salary grew 20.6% from $83,302 (2019) to $100,443 (2025). At a 2.46% compound annual growth rate, salaries are projected to reach $105,446 by 2027 — a total increase of $22,144 (26.58%) from 2019.
Note: Historical values (2019–2025) are actual BLS OEWS figures for the Utah metropolitan area, sourced from annual Occupational Employment and Wage Statistics surveys. 2026–2026 figures are current estimates, and 2027 values are projections, calculated using a 2.46% CAGR derived from 7-year BLS historical data. Actual salaries may vary based on employer, experience, certifications, and local market conditions.
Top 5 Highest Paying Cities in Utah
Lowest Paying Cities in Utah
| City | Median Salary |
|---|---|
| Clinton | $93,958 |
| North Ogden | $94,424 |
| Park City | $94,691 |
| Payson | $95,425 |
| Highland | $95,624 |
Best Value Cities for Physical Therapists in Utah
When adjusted for local cost of living, these Utah cities offer the most purchasing power for physical therapists.
| City | Nominal Salary | CoL Index | Adjusted Salary |
|---|---|---|---|
| Murray | $106,841 | 98.1 | $108,910 |
| Salt Lake City | $106,394 | 100.868 | $105,478 |
| West Jordan | $103,238 | 98.1 | $105,238 |
| West Valley City | $103,073 | 98.1 | $105,069 |
| Sandy | $102,867 | 98.1 | $104,859 |
Adjusted salary = nominal salary × (100 / CoL index). CoL index: 100 = national average. Lower index = lower cost of living.
Salary by Experience Level in Utah
| Experience Level | Estimated Annual |
|---|---|
| Entry Level (0-2 years) | $67,599 |
| Mid Career (3-7 years) | $102,914 |
| Experienced (7+ years) | $139,015 |
Estimates based on BLS percentile data averaged across Utah metro areas. Individual pay varies by employer, certifications, and specialization.
All 41 Cities in Utah
| # | City | Median Salary |
|---|---|---|
| 1 | Murray | $106,841 |
| 2 | Salt Lake City | $106,394 |
| 3 | West Jordan | $103,238 |
| 4 | West Valley City | $103,073 |
| 5 | Sandy | $102,867 |
| 6 | South Jordan | $102,280 |
| 7 | St. George | $101,784 |
| 8 | Ogden | $101,610 |
| 9 | Draper | $101,346 |
| 10 | Layton | $101,016 |
| 11 | Holladay | $100,623 |
| 12 | Spanish Fork | $100,608 |
| 13 | American Fork | $100,394 |
| 14 | Saratoga Springs | $100,284 |
| 15 | Cedar City | $100,253 |
| 16 | Logan | $100,237 |
| 17 | Cottonwood Heights | $99,914 |
| 18 | Midvale | $99,914 |
| 19 | Roy | $99,874 |
| 20 | Tooele | $99,803 |
| 21 | Herriman | $99,768 |
| 22 | Provo | $99,345 |
| 23 | Taylorsville | $99,036 |
| 24 | Kaysville | $98,888 |
| 25 | Syracuse | $98,739 |
| 26 | Washington | $98,707 |
| 27 | Orem | $98,300 |
| 28 | Millcreek | $98,152 |
| 29 | Bountiful | $97,516 |
| 30 | Lehi | $97,370 |
| 31 | Clearfield | $97,059 |
| 32 | Pleasant Grove | $96,996 |
| 33 | Springville | $96,396 |
| 34 | Eagle Mountain | $96,357 |
| 35 | Riverton | $96,255 |
| 36 | Vineyard | $96,097 |
| 37 | Highland | $95,624 |
| 38 | Payson | $95,425 |
| 39 | Park City | $94,691 |
| 40 | North Ogden | $94,424 |
| 41 | Clinton | $93,958 |
More Utah Salary Data
Hourly Rates
Explore physical therapist hourly pay in Utah cities.
Senior / Experienced
Top earner salaries for experienced physical therapists.
Explore More Physical Therapist Salary Data
Frequently Asked Questions
How much do physical therapists make in Utah in 2026?
What is the highest paying city for physical therapists in Utah?
How does Utah physical therapist pay compare to the national average?
What is the entry-level physical therapist salary in Utah?
How many physical therapists are employed in Utah?
Which Utah city offers the best value for physical therapists?
Written by Alex Morgan, DPT
Career Analyst
Alex Morgan has over 10 years of experience in physical therapy. They specialize in orthopedic rehabilitation. Alex works in a private practice setting.
Methodology & Data Source
Statewide salary figures on this page are 2026 projections based on the Bureau of Labor Statistics Occupational Employment and Wage Statistics (OEWS) survey, May 2026 release. A 2.46% compound annual growth rate (CAGR), derived from 6-year national BLS wage trends, was applied to each metro area's reported salary to estimate current 2026 physical therapist compensation across Utah. State averages are employment-weighted across 41 metro areas — larger metro areas with more physical therapistscontribute proportionally more to the average, producing figures that better reflect typical compensation. Individual pay varies by city, employer, certifications, and experience.
Data Sources & Methodology
Source: BLS, OEWS, 7-year dataset (–). Per-city data from annual BLS metropolitan area surveys.
2026 figures are projected from 2025 BLS data using a compound annual growth rate (CAGR) of 2.46%, derived from historical BLS wage trends for physical therapists (SOC 29-1123).
Compiled and verified by Alex Morgan, DPT, a licensed physical therapist with 10+ years of clinical experience. · View source data at BLS.gov