Physical Therapist Salary in Barre, VT: $102,881 (2026)
Quick Answer:A full-time physical therapist in Barre, VT earns a median $102,881/year (≈ $49.46/hour) in nominal terms for 2026 — projected from BLS OEWS 2025 (SOC 29-1123). Once you factor in Barre's price level (4% above national, BEA RPP 103.5), that paycheck buys what $99,402 would nationally. Nominal pay sits 5.6% below the Vermont state average.
Based on BLS state-level estimates · View source
In Barre, Vermont, physical therapist salaries show a promising future, with a median annual income projected at $102,881 in 2026. This figure reflects a competitive landscape compared to the national median of $105,288, positioning Barre's compensation slightly below the national average. The salary range in the local market spans from $78,945 at the 10th percentile to $124,218 at the 90th percentile, indicating significant potential for earnings based on experience and productivity. These estimates, derived from 2025 BLS data adjusted for regional cost of living, reveal how productivity expectations—often measured in visits per day—shape compensation models. Those willing to excel in high-demand outpatient settings may find the best prospects, as the job market seeks skilled professionals who can optimize their effectiveness in the field.
About the Barre Market
Salary estimated from Vermont average ($90,000) adjusted for local cost of living.
Salary Breakdown
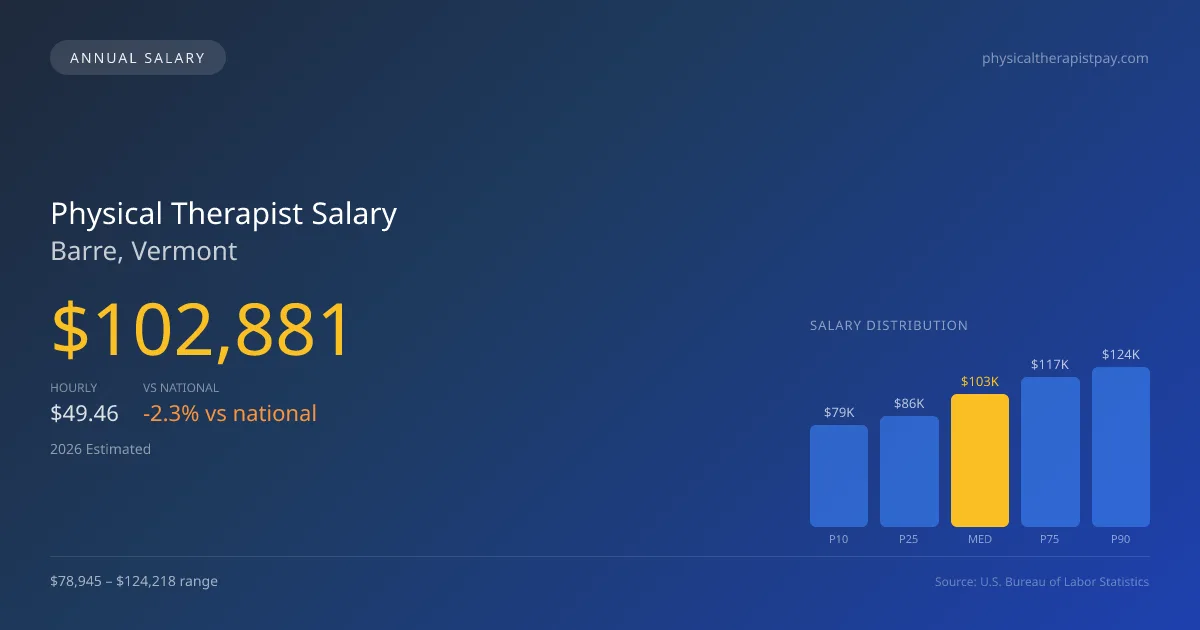
| Percentile | Annual | Hourly |
|---|---|---|
| Entry Level (P10) | $78,945 | $37.95 |
| Lower Range (P25) | $85,840 | $41.27 |
| Median (P50)(typical) | $102,881 | $49.46 |
| Upper Range (P75) | $116,521 | $56.01 |
| Top Earners (P90) | $124,218 | $59.72 |
Median Salary Position
2.29% below the national average
2026 Salary Percentile Distribution in Barre
In Barre, VT, the physical therapist salary spread from the 10th to 90th percentile is $45,273 (2026 est.). At $102,881, the local median is 2.29% below the national median of $105,288.
Salary Calculator
At 40 hours/week in Barre: You'd be above the median
How Barre Physical Therapist Pay Compares
Barre median: $102,881/year (2026)
| Compared To | Median Salary | Barre Pays |
|---|---|---|
| Vermont Average | $108,984 | -5.60% less |
| National Average | $105,288 | -2.29% less |
Physical Therapists in Barre, VT earn a median of $102,881 per year (2026 est.), which is 2.29% lower than the national median of $105,288 and 5.60% below the Vermont state average of $108,984.
Cost-of-Living Adjusted Salary
Barre has a cost of living 3.50% above the national average.
Adjusted salary = nominal × (100 / CoL index). CoL index: 100 = national average.
Barre, VT has a cost-of-living index of 103.5 (above the national average of 100). While the nominal salary of $102,881 is competitive, the higher cost of living reduces purchasing power to an effective $99,402 — a 3.38% reduction.
Compare Purchasing Power
Select a city to see how your salary compares after cost of living
Select a city above to compare purchasing power
2019 BLS Actual
$87,395
2025 BLS Actual
$100,411
2026 Current Est.
$102,881
2019–2027 Growth
+20.6%
Salary Trajectory for Physical Therapists in Barre (2019–2027)
2019–2025: actual BLS OEWS data for this metro area. 2026+: CAGR 2.46% projection.
| Year | Annual Salary | Status |
|---|---|---|
| 2019 | $87,395 | Actual |
| 2020 | $88,930 | Actual |
| 2021 | $93,434 | Actual |
| 2022 | $95,486 | Actual |
| 2023 | $97,431 | Actual |
| 2024 | $87,943 | Actual |
| 2025 | $100,411 | Actual |
| 2026(current) | $102,881 | Estimated |
| 2027 | $105,412 | Projected |
Based on 7 years of BLS OEWS data for the Barre metropolitan area, the median physical therapist salary grew 14.9% from $87,395 (2019) to $100,411 (2025). At a 2.46% compound annual growth rate, salaries are projected to reach $105,412 by 2027 — a total increase of $18,017 (20.62%) from 2019.
Note: Historical values (2019–2025) are actual BLS OEWS figures for the Barre metropolitan area, sourced from annual Occupational Employment and Wage Statistics surveys. 2026–2026 figures are current estimates, and 2027 values are projections, calculated using a 2.46% CAGR derived from 7-year BLS historical data. Actual salaries may vary based on employer, experience, certifications, and local market conditions.
Salary by Experience Level
| Experience | Estimated Salary Range |
|---|---|
| 0-2 years (New Graduate) | $78,945 – $85,840 |
| 3-5 years (Mid Career) | $85,840 – $102,881 |
| 5+ years (Experienced) | $102,881 – $116,521 |
| 10+ years (Top Earner) | $116,521 – $124,218 |
PT salary ranges estimated from BLS percentile data. Individual physical therapist compensation varies by employer, certifications, and specialization.
Physical Therapist Job Market in Barre
With only six physical therapists currently employed in the Barre area, the job market is rather niche, which may give room for negotiation on salaries as demand increases. The cost-of-living index in Barre stands at 103.5, suggesting a slightly higher living cost compared to the national average. This impacts overall take-home pay and negotiating power in salary discussions. Outpatient orthopedic clinics often dominate the landscape for higher-paying opportunities, particularly those linked to chains like ATI and Athletico. The disparity in earnings can largely be attributed to various factors including productivity expectations, reimbursement models, and specialization credentials. For physical therapists in Barre, seeking board certifications such as OCS or SCS can enhance earning potential, coupled with a strategic approach to patient management that balances cash-pay and insurance practices. Staying informed about market trends and actively participating in local professional networks will also serve to maximize pay and career advancement in this distinct environment.
More salary data for Barre, VT:
Frequently Asked Questions
How much do physical therapists make in Barre, VT in 2026?
Is Barre, VT a good place to work as a physical therapist?
Can physical therapists make $100K in Barre?
What is the cost-of-living adjusted physical therapist salary in Barre?
How much does a physical therapist make per hour in Barre?
Related Pages
Compare Salaries
Career Resources
Nearby Cities in Vermont
Written by Alex Morgan, DPT
Career Analyst
Alex Morgan has over 10 years of experience in physical therapy. They specialize in orthopedic rehabilitation. Alex works in a private practice setting.
Methodology & Data Source
Salary figures on this page are 2026 projections based on the Bureau of Labor Statistics Occupational Employment and Wage Statistics (OEWS) survey, May 2026 release. The BLS reported a median annual salary of $100,411 for physical therapistsin the Barre metropolitan area. A 2.46% compound annual growth rate (CAGR), calculated from 6-year national BLS wage trends, was applied to project current 2026 compensation. Percentile ranges (P10–P90) represent the full salary distribution across experience levels and practice settings in this market.
Data Sources & Methodology
Salary data for Barre is estimated from official BLS state-level occupational wage data (2025), adjusted for regional cost-of-living differences using BEA RPP (Regional Price Parities).
2026 figures are projected from 2025 BLS data using a compound annual growth rate (CAGR) of 2.46%, derived from historical BLS wage trends for physical therapists (SOC 29-1123).
Compiled and verified by Alex Morgan, DPT, a licensed physical therapist with 10+ years of clinical experience. · View source data at BLS.gov