Physical Therapist Salary in Bristol, VA: $103,444 (2026)
Quick Answer:A full-time physical therapist in Bristol, VA earns a median $103,444/year (≈ $49.73/hour) in nominal terms for 2026 — projected from BLS OEWS 2025 (SOC 29-1123). Once you factor in Bristol's price level (3% above national, BEA RPP 103.2), that paycheck buys what $100,236 would nationally. Nominal pay sits 1.4% below the Virginia state average.
Based on BLS state-level estimates · View source
In 2026, physical therapist salaries in Bristol, Virginia, are projected to reach a median annual figure of $103,444. This compensation reflects a broad pay range, with the lowest earners making around $82,659, while the top 10% can expect to earn approximately $128,523. These salary estimates are based on 2025 BLS data, adjusted for local cost factors, which place Bristol's pay slightly below the national median of $105,288. As productivity expectations continue to shape the healthcare landscape, therapists in the area must balance patient visits per day with the financial rewards of their profession, making effective compensation strategies essential for long-term success.
About the Bristol Market
Salary estimated from Virginia average ($95,000) adjusted for local cost of living.
Salary Breakdown
| Percentile | Annual | Hourly |
|---|---|---|
| Entry Level (P10) | $82,659 | $39.74 |
| Lower Range (P25) | $88,696 | $42.64 |
| Median (P50)(typical) | $103,444 | $49.73 |
| Upper Range (P75) | $119,401 | $57.41 |
| Top Earners (P90) | $128,523 | $61.79 |
Median Salary Position
1.75% below the national average
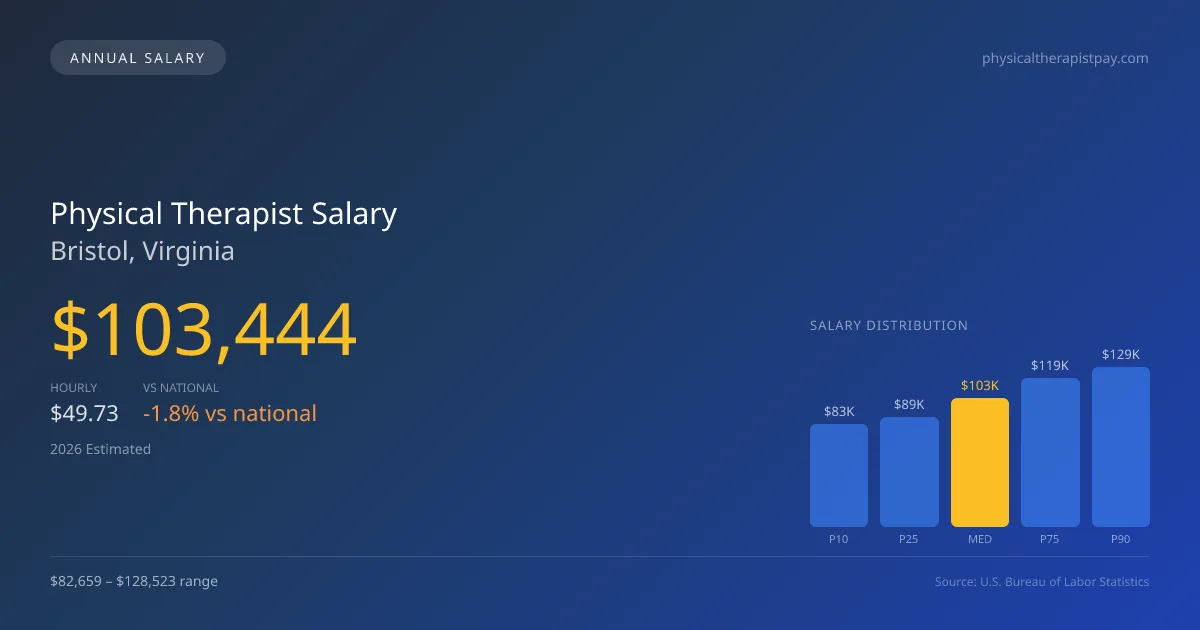
2026 Salary Percentile Distribution in Bristol
In Bristol, VA, the physical therapist salary spread from the 10th to 90th percentile is $45,864 (2026 est.). At $103,444, the local median is 1.75% below the national median of $105,288.
Salary Calculator
At 40 hours/week in Bristol: You'd be in the lower-middle range
How Bristol Physical Therapist Pay Compares
Bristol median: $103,444/year (2026)
| Compared To | Median Salary | Bristol Pays |
|---|---|---|
| Virginia Average | $104,912 | -1.40% less |
| National Average | $105,288 | -1.75% less |
Physical Therapists in Bristol, VA earn a median of $103,444 per year (2026 est.), which is 1.75% lower than the national median of $105,288 and 1.40% below the Virginia state average of $104,912.
Cost-of-Living Adjusted Salary
Bristol has a cost of living 3.20% above the national average.
Adjusted salary = nominal × (100 / CoL index). CoL index: 100 = national average.
Bristol, VA has a cost-of-living index of 103.2 (above the national average of 100). While the nominal salary of $103,444 is competitive, the higher cost of living reduces purchasing power to an effective $100,236 — a 3.1% reduction.
Compare Purchasing Power
Select a city to see how your salary compares after cost of living
Select a city above to compare purchasing power
2019 BLS Actual
$87,873
2025 BLS Actual
$100,960
2026 Current Est.
$103,444
2019–2027 Growth
+20.6%
Salary Trajectory for Physical Therapists in Bristol (2019–2027)
2019–2025: actual BLS OEWS data for this metro area. 2026+: CAGR 2.46% projection.
| Year | Annual Salary | Status |
|---|---|---|
| 2019 | $87,873 | Actual |
| 2020 | $89,416 | Actual |
| 2021 | $93,945 | Actual |
| 2022 | $96,008 | Actual |
| 2023 | $97,963 | Actual |
| 2024 | $94,277 | Actual |
| 2025 | $100,960 | Actual |
| 2026(current) | $103,444 | Estimated |
| 2027 | $105,988 | Projected |
Based on 7 years of BLS OEWS data for the Bristol metropolitan area, the median physical therapist salary grew 14.9% from $87,873 (2019) to $100,960 (2025). At a 2.46% compound annual growth rate, salaries are projected to reach $105,988 by 2027 — a total increase of $18,115 (20.61%) from 2019.
Note: Historical values (2019–2025) are actual BLS OEWS figures for the Bristol metropolitan area, sourced from annual Occupational Employment and Wage Statistics surveys. 2026–2026 figures are current estimates, and 2027 values are projections, calculated using a 2.46% CAGR derived from 7-year BLS historical data. Actual salaries may vary based on employer, experience, certifications, and local market conditions.
Salary by Experience Level
| Experience | Estimated Salary Range |
|---|---|
| 0-2 years (New Graduate) | $82,659 – $88,696 |
| 3-5 years (Mid Career) | $88,696 – $103,444 |
| 5+ years (Experienced) | $103,444 – $119,401 |
| 10+ years (Top Earner) | $119,401 – $128,523 |
PT salary ranges estimated from BLS percentile data. Individual physical therapist compensation varies by employer, certifications, and specialization.
Physical Therapist Job Market in Bristol
The local job market for physical therapists in Bristol remains tight, with only six professionals currently employed in the area. This limited workforce combined with a cost-of-living index of 103.2 indicates that while therapists may face financial pressures, take-home purchasing power can vary significantly. Outpatient orthopedic clinics, particularly larger chains like ATI and Athletico, tend to offer competitive pay, while hospital systems may provide superior benefits packages. The salary spread in Bristol can be attributed to various factors, including productivity benchmarks and potential stipends for board certifications such as Orthopedic (OCS) and Sports (SCS). Therapists aiming to optimize their earnings should consider strategies like pursuing specialized certifications and negotiating pay structures that prioritize patient volume, especially in a cash-pay versus insurance practice model that is increasingly prevalent in today’s healthcare climate.
More salary data for Bristol, VA:
Frequently Asked Questions
How much do physical therapists make in Bristol, VA in 2026?
Is Bristol, VA a good place to work as a physical therapist?
Can physical therapists make $100K in Bristol?
What is the cost-of-living adjusted physical therapist salary in Bristol?
How much does a physical therapist make per hour in Bristol?
Related Pages
Compare Salaries
Career Resources
Nearby Cities in Virginia
Written by Alex Morgan, DPT
Career Analyst
Alex Morgan has over 10 years of experience in physical therapy. They specialize in orthopedic rehabilitation. Alex works in a private practice setting.
Methodology & Data Source
Salary figures on this page are 2026 projections based on the Bureau of Labor Statistics Occupational Employment and Wage Statistics (OEWS) survey, May 2026 release. The BLS reported a median annual salary of $100,960 for physical therapistsin the Bristol metropolitan area. A 2.46% compound annual growth rate (CAGR), calculated from 6-year national BLS wage trends, was applied to project current 2026 compensation. Percentile ranges (P10–P90) represent the full salary distribution across experience levels and practice settings in this market.
Data Sources & Methodology
Salary data for Bristol is estimated from official BLS state-level occupational wage data (2025), adjusted for regional cost-of-living differences using BEA RPP (Regional Price Parities).
2026 figures are projected from 2025 BLS data using a compound annual growth rate (CAGR) of 2.46%, derived from historical BLS wage trends for physical therapists (SOC 29-1123).
Compiled and verified by Alex Morgan, DPT, a licensed physical therapist with 10+ years of clinical experience. · View source data at BLS.gov