Physical Therapist Salary in Pullman, WA: $105,501 (2026)
Quick Answer:A full-time physical therapist in Pullman, WA earns a median $105,501/year (≈ $50.72/hour) in nominal terms for 2026 — projected from BLS OEWS 2025 (SOC 29-1123). Once you factor in Pullman's price level (7% above national, BEA RPP 107.4), that paycheck buys what $98,232 would nationally. Nominal pay sits 4.0% below the Washington state average.
Based on BLS state-level estimates · View source
The average physical therapist salary in Pullman is projected to be $105,501 in 2026, which is slightly higher than the national median of $105,288, reflecting both local market demand and cost considerations specific to the region. Salaries are expected to range widely, from $84,550 at the 10th percentile to $138,880 at the 90th percentile, providing a framework that reflects differing levels of experience, specialization, and productivity expectations. These projections are derived from 2025 BLS data and account for regional price adjustments, helping to shape a nuanced understanding of compensation within Pullman’s healthcare landscape, where therapists often balance patient loads and clinical productivity.
About the Pullman Market
Salary estimated from Washington average ($99,000) adjusted for local cost of living.
Salary Breakdown
| Percentile | Annual | Hourly |
|---|---|---|
| Entry Level (P10) | $84,550 | $40.65 |
| Lower Range (P25) | $91,158 | $43.82 |
| Median (P50)(typical) | $105,501 | $50.72 |
| Upper Range (P75) | $125,589 | $60.38 |
| Top Earners (P90) | $138,880 | $66.77 |
Median Salary Position
0.20% above the national average
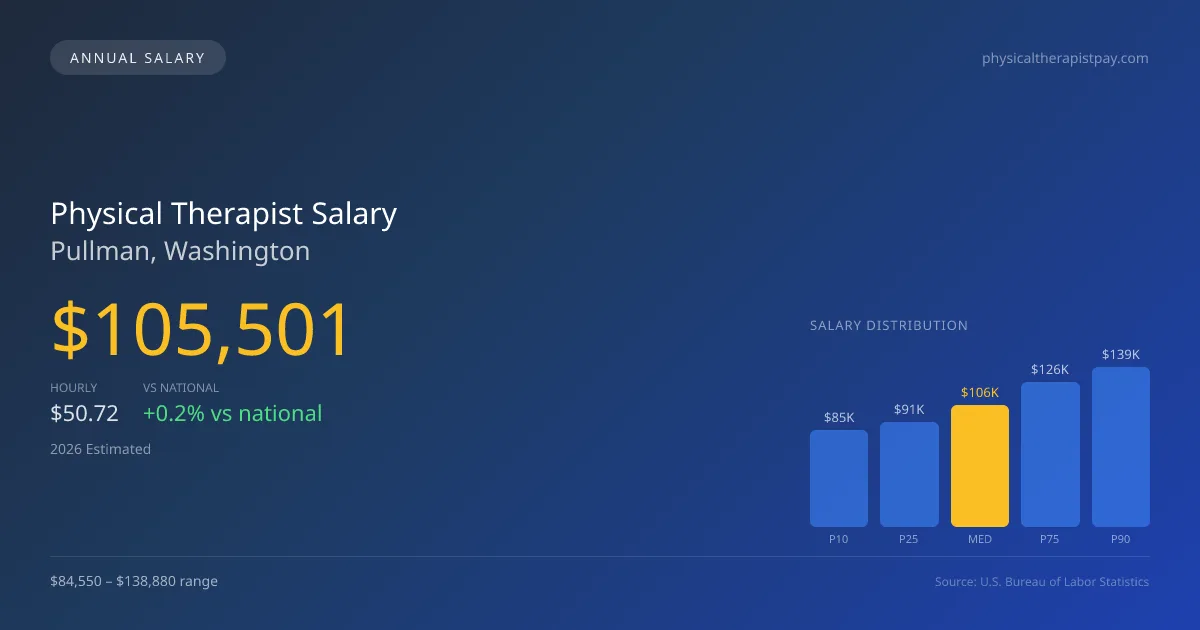
2026 Salary Percentile Distribution in Pullman
In Pullman, WA, the physical therapist salary spread from the 10th to 90th percentile is $54,330 (2026 est.). At $105,501, the local median is 0.2% above the national median of $105,288.
Salary Calculator
At 40 hours/week in Pullman: You'd be in the lower-middle range
How Pullman Physical Therapist Pay Compares
Pullman median: $105,501/year (2026)
| Compared To | Median Salary | Pullman Pays |
|---|---|---|
| Washington Average | $109,897 | -4.00% less |
| National Average | $105,288 | +0.20% more |
Physical Therapists in Pullman, WA earn a median of $105,501 per year (2026 est.), which is 0.20% higher than the national median of $105,288 and 4.00% below the Washington state average of $109,897.
Cost-of-Living Adjusted Salary
Pullman has a cost of living 7.40% above the national average.
Adjusted salary = nominal × (100 / CoL index). CoL index: 100 = national average.
Pullman, WA has a cost-of-living index of 107.4 (above the national average of 100). While the nominal salary of $105,501 is competitive, the higher cost of living reduces purchasing power to an effective $98,232 — a 6.89% reduction.
Compare Purchasing Power
Select a city to see how your salary compares after cost of living
Select a city above to compare purchasing power
2019 BLS Actual
$89,621
2025 BLS Actual
$102,968
2026 Current Est.
$105,501
2019–2027 Growth
+20.6%
Salary Trajectory for Physical Therapists in Pullman (2019–2027)
2019–2025: actual BLS OEWS data for this metro area. 2026+: CAGR 2.46% projection.
| Year | Annual Salary | Status |
|---|---|---|
| 2019 | $89,621 | Actual |
| 2020 | $91,194 | Actual |
| 2021 | $95,814 | Actual |
| 2022 | $97,918 | Actual |
| 2023 | $99,912 | Actual |
| 2024 | $102,043 | Actual |
| 2025 | $102,968 | Actual |
| 2026(current) | $105,501 | Estimated |
| 2027 | $108,096 | Projected |
Based on 7 years of BLS OEWS data for the Pullman metropolitan area, the median physical therapist salary grew 14.9% from $89,621 (2019) to $102,968 (2025). At a 2.46% compound annual growth rate, salaries are projected to reach $108,096 by 2027 — a total increase of $18,475 (20.61%) from 2019.
Note: Historical values (2019–2025) are actual BLS OEWS figures for the Pullman metropolitan area, sourced from annual Occupational Employment and Wage Statistics surveys. 2026–2026 figures are current estimates, and 2027 values are projections, calculated using a 2.46% CAGR derived from 7-year BLS historical data. Actual salaries may vary based on employer, experience, certifications, and local market conditions.
Salary by Experience Level
| Experience | Estimated Salary Range |
|---|---|
| 0-2 years (New Graduate) | $84,550 – $91,158 |
| 3-5 years (Mid Career) | $91,158 – $105,501 |
| 5+ years (Experienced) | $105,501 – $125,589 |
| 10+ years (Top Earner) | $125,589 – $138,880 |
PT salary ranges estimated from BLS percentile data. Individual physical therapist compensation varies by employer, certifications, and specialization.
Physical Therapist Job Market in Pullman
With only six physical therapists currently employed in the area, Pullman offers a tight-knit job market that can influence salary dynamics. The local cost-of-living index is at 107.4, slightly above the national average, impacting the real purchasing power of salaries. Among local employers, outpatient orthopedic clinics, such as those operating under national chains like Athletico, tend to offer competitive salaries, though they may come with higher productivity expectations. Managing patient visits efficiently can lead to bonuses and higher earnings, particularly in a cash-pay versus insurance setting where therapists may enjoy greater flexibility. Specialists with certifications like OCS or SCS can also command higher pay. Those considering a career in physical therapy in Pullman should focus on increasing their clinical efficiency and diversity of services offered, positioning themselves for the best compensation opportunities in a compact and competitive market.
More salary data for Pullman, WA:
Frequently Asked Questions
How much do physical therapists make in Pullman, WA in 2026?
Is Pullman, WA a good place to work as a physical therapist?
Can physical therapists make $100K in Pullman?
What is the cost-of-living adjusted physical therapist salary in Pullman?
How much does a physical therapist make per hour in Pullman?
Related Pages
Compare Salaries
Career Resources
Nearby Cities in Washington
Written by Alex Morgan, DPT
Career Analyst
Alex Morgan has over 10 years of experience in physical therapy. They specialize in orthopedic rehabilitation. Alex works in a private practice setting.
Methodology & Data Source
Salary figures on this page are 2026 projections based on the Bureau of Labor Statistics Occupational Employment and Wage Statistics (OEWS) survey, May 2026 release. The BLS reported a median annual salary of $102,968 for physical therapistsin the Pullman metropolitan area. A 2.46% compound annual growth rate (CAGR), calculated from 6-year national BLS wage trends, was applied to project current 2026 compensation. Percentile ranges (P10–P90) represent the full salary distribution across experience levels and practice settings in this market.
Data Sources & Methodology
Salary data for Pullman is estimated from official BLS state-level occupational wage data (2025), adjusted for regional cost-of-living differences using BEA RPP (Regional Price Parities).
2026 figures are projected from 2025 BLS data using a compound annual growth rate (CAGR) of 2.46%, derived from historical BLS wage trends for physical therapists (SOC 29-1123).
Compiled and verified by Alex Morgan, DPT, a licensed physical therapist with 10+ years of clinical experience. · View source data at BLS.gov