Physical Therapist Salary in Puyallup, WA: $105,262 (2026)
Quick Answer:A full-time physical therapist in Puyallup, WA earns a median $105,262/year (≈ $50.60/hour) in nominal terms for 2026 — projected from BLS OEWS 2025 (SOC 29-1123). Once you factor in Puyallup's price level (7% above national, BEA RPP 107.4), that paycheck buys what $98,009 would nationally. Nominal pay sits 4.2% below the Washington state average.
Based on BLS state-level estimates · View source
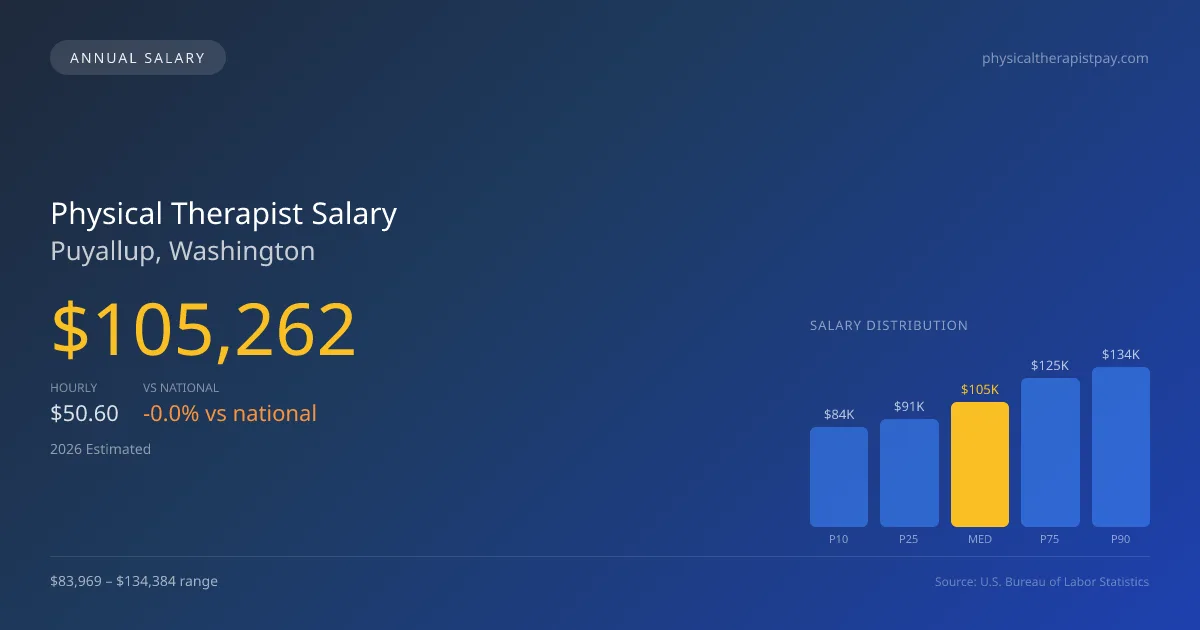
In 2026, physical therapists in Puyallup, Washington, can expect a median annual salary of $105,262, closely aligning with the national median of $105,288. The local salary range extends from $83,969 at the lower decile (P10) to $134,384 at the upper decile (P90), reflecting a competitive market for physical therapist pay in Puyallup, WA. Estimates derived from 2025 BLS data, adjusted for regional cost factors, indicate that the local market is characterized by outpatient orthopedic clinics—often offering lower base salaries but with potential for productivity bonuses. The choice between working in these clinics versus hospital systems or skilled nursing facilities can significantly impact earnings, highlighting the importance of understanding local employment dynamics.
About the Puyallup Market
Salary estimated from Washington average ($99,000) adjusted for local cost of living.
Salary Breakdown
| Percentile | Annual | Hourly |
|---|---|---|
| Entry Level (P10) | $83,969 | $40.37 |
| Lower Range (P25) | $90,664 | $43.59 |
| Median (P50)(typical) | $105,262 | $50.60 |
| Upper Range (P75) | $125,026 | $60.11 |
| Top Earners (P90) | $134,384 | $64.61 |
Median Salary Position
0.02% below the national average
2026 Salary Percentile Distribution in Puyallup
In Puyallup, WA, the physical therapist salary spread from the 10th to 90th percentile is $50,415 (2026 est.). At $105,262, the local median is 0.02% below the national median of $105,288.
Salary Calculator
At 40 hours/week in Puyallup: You'd be in the lower-middle range
How Puyallup Physical Therapist Pay Compares
Puyallup median: $105,262/year (2026)
| Compared To | Median Salary | Puyallup Pays |
|---|---|---|
| Washington Average | $109,877 | -4.20% less |
| National Average | $105,288 | -0.02% less |
Physical Therapists in Puyallup, WA earn a median of $105,262 per year (2026 est.), which is 0.02% lower than the national median of $105,288 and 4.20% below the Washington state average of $109,877.
Cost-of-Living Adjusted Salary
Puyallup has a cost of living 7.40% above the national average.
Adjusted salary = nominal × (100 / CoL index). CoL index: 100 = national average.
Puyallup, WA has a cost-of-living index of 107.4 (above the national average of 100). While the nominal salary of $105,262 is competitive, the higher cost of living reduces purchasing power to an effective $98,009 — a 6.89% reduction.
Compare Purchasing Power
Select a city to see how your salary compares after cost of living
Select a city above to compare purchasing power
2019 BLS Actual
$89,418
2025 BLS Actual
$102,735
2026 Current Est.
$105,262
2019–2027 Growth
+20.6%
Salary Trajectory for Physical Therapists in Puyallup (2019–2027)
2019–2025: actual BLS OEWS data for this metro area. 2026+: CAGR 2.46% projection.
| Year | Annual Salary | Status |
|---|---|---|
| 2019 | $89,418 | Actual |
| 2020 | $90,988 | Actual |
| 2021 | $95,597 | Actual |
| 2022 | $97,696 | Actual |
| 2023 | $99,686 | Actual |
| 2024 | $101,812 | Actual |
| 2025 | $102,735 | Actual |
| 2026(current) | $105,262 | Estimated |
| 2027 | $107,852 | Projected |
Based on 7 years of BLS OEWS data for the Puyallup metropolitan area, the median physical therapist salary grew 14.9% from $89,418 (2019) to $102,735 (2025). At a 2.46% compound annual growth rate, salaries are projected to reach $107,852 by 2027 — a total increase of $18,434 (20.62%) from 2019.
Note: Historical values (2019–2025) are actual BLS OEWS figures for the Puyallup metropolitan area, sourced from annual Occupational Employment and Wage Statistics surveys. 2026–2026 figures are current estimates, and 2027 values are projections, calculated using a 2.46% CAGR derived from 7-year BLS historical data. Actual salaries may vary based on employer, experience, certifications, and local market conditions.
Salary by Experience Level
| Experience | Estimated Salary Range |
|---|---|
| 0-2 years (New Graduate) | $83,969 – $90,664 |
| 3-5 years (Mid Career) | $90,664 – $105,262 |
| 5+ years (Experienced) | $105,262 – $125,026 |
| 10+ years (Top Earner) | $125,026 – $134,384 |
PT salary ranges estimated from BLS percentile data. Individual physical therapist compensation varies by employer, certifications, and specialization.
Physical Therapist Job Market in Puyallup
The job market in Puyallup comprises 10 physical therapists, making it a relatively small field but one with strong local demand. The cost-of-living index stands at 107.4, slightly above the national average, suggesting that while salaries are competitive, take-home pay may effectively be impacted by living expenses. Among local employers, outpatient orthopedic chains, such as ATI and Athletico, tend to offer lower base salaries compared to hospitals, which may pay more for inpatient rehabilitative services. Factors that drive the variability in pay include productivity expectations in outpatient settings, such as units per visit and visits per day, along with additional incentives tied to board certifications like OCS or SCS. To enhance compensation in this local market, physical therapists might consider pursuing specialized certifications, exploring ownership equity in private practices, or transitioning to cash-pay models that can better align reimbursement with the quality of care provided.
More salary data for Puyallup, WA:
Frequently Asked Questions
How much do physical therapists make in Puyallup, WA in 2026?
Is Puyallup, WA a good place to work as a physical therapist?
Can physical therapists make $100K in Puyallup?
What is the cost-of-living adjusted physical therapist salary in Puyallup?
How much does a physical therapist make per hour in Puyallup?
Related Pages
Compare Salaries
Career Resources
Nearby Cities in Washington
Written by Alex Morgan, DPT
Career Analyst
Alex Morgan has over 10 years of experience in physical therapy. They specialize in orthopedic rehabilitation. Alex works in a private practice setting.
Methodology & Data Source
Salary figures on this page are 2026 projections based on the Bureau of Labor Statistics Occupational Employment and Wage Statistics (OEWS) survey, May 2026 release. The BLS reported a median annual salary of $102,735 for physical therapistsin the Puyallup metropolitan area. A 2.46% compound annual growth rate (CAGR), calculated from 6-year national BLS wage trends, was applied to project current 2026 compensation. Percentile ranges (P10–P90) represent the full salary distribution across experience levels and practice settings in this market.
Data Sources & Methodology
Salary data for Puyallup is estimated from official BLS state-level occupational wage data (2025), adjusted for regional cost-of-living differences using BEA RPP (Regional Price Parities).
2026 figures are projected from 2025 BLS data using a compound annual growth rate (CAGR) of 2.46%, derived from historical BLS wage trends for physical therapists (SOC 29-1123).
Compiled and verified by Alex Morgan, DPT, a licensed physical therapist with 10+ years of clinical experience. · View source data at BLS.gov