Physical Therapist Salary in Yakima, WA: $108,556 (2026)
Quick Answer:A full-time physical therapist in Yakima, WA earns a median $108,556/year (≈ $52.19/hour) in nominal terms for 2026 — projected from BLS OEWS 2025 (SOC 29-1123). Once you factor in Yakima's price level (4% below national, BEA RPP 95.5), that paycheck buys what $113,618 would nationally. Nominal pay sits 1.2% below the Washington state average.
Official BLS data · View source
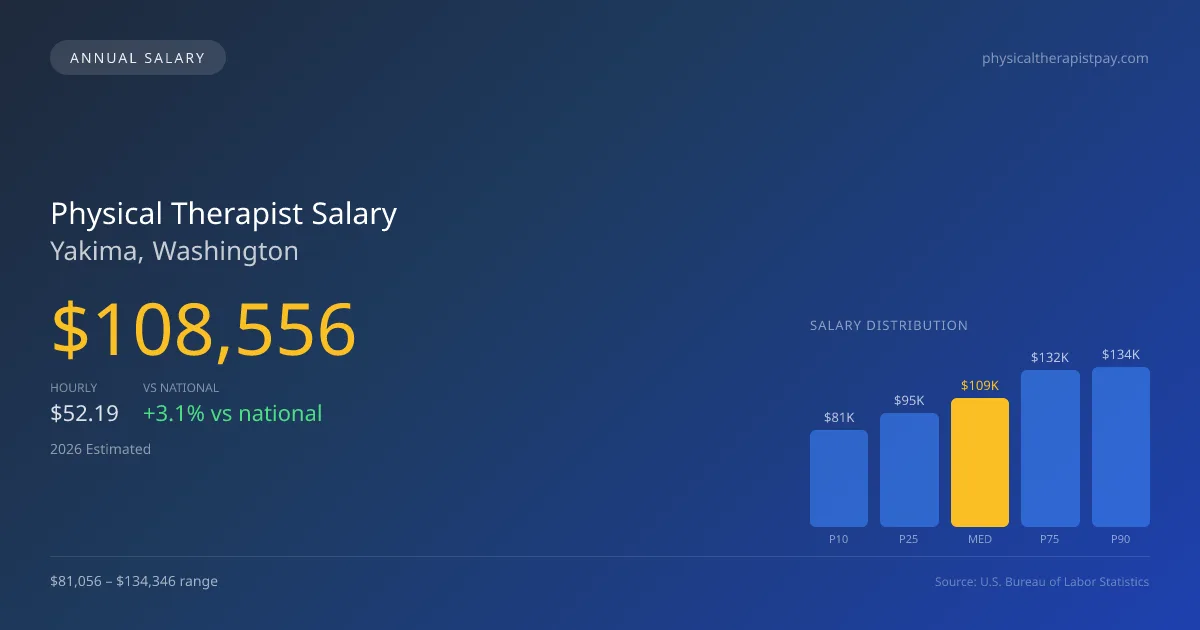
In 2026, a physical therapist in Yakima, Washington can expect a median annual salary of $108,556, reflecting the growing trend of cash-pay services in the sports and orthopedic fields which often elevates top-end earnings. Salary ranges for this profession span from $81,056 at the lower end (P10) to as high as $134,346 (P90) for those with specialized skills and experience. This data, derived from 2025 BLS OEWS surveys, showcases Yakima's competitive compensation landscape, particularly as more facilities shift toward cash-pay models that can boost earnings for high-performing therapists. As the demand for specialized care continues to rise, Yakima presents promising opportunities for physical therapists looking to advance their careers and income.
Salary Breakdown
| Percentile | Annual | Hourly |
|---|---|---|
| Entry Level (P10) | $81,056 | $38.97 |
| Lower Range (P25) | $95,339 | $45.84 |
| Median (P50)(typical) | $108,556 | $52.19 |
| Upper Range (P75) | $131,825 | $63.38 |
| Top Earners (P90) | $134,346 | $64.59 |
Median Salary Position
3.10% above the national average
2026 Salary Percentile Distribution in Yakima
In Yakima, WA, the physical therapist salary spread from the 10th to 90th percentile is $53,290 (2026 est.). At $108,556, the local median is 3.1% above the national median of $105,288.
Salary Calculator
At 40 hours/week in Yakima: You'd be above the median
How Yakima Physical Therapist Pay Compares
Yakima median: $108,556/year (2026)
| Compared To | Median Salary | Yakima Pays |
|---|---|---|
| Washington Average | $109,875 | -1.20% less |
| National Average | $105,288 | +3.10% more |
Physical Therapists in Yakima, WA earn a median of $108,556 per year (2026 est.), which is 3.10% higher than the national median of $105,288 and 1.20% below the Washington state average of $109,875.
Cost-of-Living Adjusted Salary
Yakima has a cost of living 4.45% below the national average, meaning your salary goes further here.
Adjusted salary = nominal × (100 / CoL index). CoL index: 100 = national average.
Yakima, WA has a cost-of-living index of 95.545 (below the national average of 100). A physical therapist earning $108,556 nominally has purchasing power equivalent to $113,618 in an average-cost city — an effective 4.66% boost.
Compare Purchasing Power
Select a city to see how your salary compares after cost of living
Select a city above to compare purchasing power
2019 BLS Actual
$93,160
2025 BLS Actual
$105,950
2026 Current Est.
$108,556
2019–2027 Growth
+19.4%
Salary Trajectory for Physical Therapists in Yakima (2019–2027)
2019–2025: actual BLS OEWS data for this metro area. 2026+: CAGR 2.46% projection.
| Year | Annual Salary | Status |
|---|---|---|
| 2019 | $93,160 | Actual |
| 2020 | $90,680 | Actual |
| 2021 | $99,040 | Actual |
| 2022 | $99,170 | Actual |
| 2023 | $104,800 | Actual |
| 2024 | $102,140 | Actual |
| 2025 | $105,950 | Actual |
| 2026(current) | $108,556 | Estimated |
| 2027 | $111,227 | Projected |
Based on 7 years of BLS OEWS data for the Yakima metropolitan area, the median physical therapist salary grew 13.7% from $93,160 (2019) to $105,950 (2025). At a 2.46% compound annual growth rate, salaries are projected to reach $111,227 by 2027 — a total increase of $18,067 (19.39%) from 2019.
Note: Historical values (2019–2025) are actual BLS OEWS figures for the Yakima metropolitan area, sourced from annual Occupational Employment and Wage Statistics surveys. 2026–2026 figures are current estimates, and 2027 values are projections, calculated using a 2.46% CAGR derived from 7-year BLS historical data. Actual salaries may vary based on employer, experience, certifications, and local market conditions.
Salary by Experience Level
| Experience | Estimated Salary Range |
|---|---|
| 0-2 years (New Graduate) | $81,056 – $95,339 |
| 3-5 years (Mid Career) | $95,339 – $108,556 |
| 5+ years (Experienced) | $108,556 – $131,825 |
| 10+ years (Top Earner) | $131,825 – $134,346 |
PT salary ranges estimated from BLS percentile data. Individual physical therapist compensation varies by employer, certifications, and specialization.
Physical Therapist Job Market in Yakima
The local job market for physical therapists in Yakima is robust, with approximately 100 professionals currently employed in the region. Coupled with a cost of living index of 95.545, this environment allows for decent purchasing power, making the physical therapist pay in Yakima WA relatively attractive. Outpatient orthopedic clinics, including chains like Athletico and ATI, generally offer competitive salaries, but some hospital systems and specialized facilities may provide higher compensation due to their focus on comprehensive rehabilitation services. Factors influencing the variation in pay include expectations regarding productivity—measured in units per visit—and the value placed on board certification, such as OCS and SCS credentials. Therapists who own or have equity in their clinics may also see enhanced earnings. For those aiming to maximize their income, pursuing advanced specialties and certifications, as well as understanding the nuances of both insurance and cash-pay models, will be critical strategies in this evolving market.
More salary data for Yakima, WA:
Frequently Asked Questions
How much do physical therapists make in Yakima, WA in 2026?
Is Yakima, WA a good place to work as a physical therapist?
Can physical therapists make $100K in Yakima?
What is the cost-of-living adjusted physical therapist salary in Yakima?
How much does a physical therapist make per hour in Yakima?
Related Pages
Compare Salaries
Career Resources
Nearby Cities in Washington
Written by Alex Morgan, DPT
Career Analyst
Alex Morgan has over 10 years of experience in physical therapy. They specialize in orthopedic rehabilitation. Alex works in a private practice setting.
Methodology & Data Source
Salary figures on this page are 2026 projections based on the Bureau of Labor Statistics Occupational Employment and Wage Statistics (OEWS) survey, May 2026 release. The BLS reported a median annual salary of $105,950 for physical therapistsin the Yakima metropolitan area. A 2.46% compound annual growth rate (CAGR), calculated from 6-year national BLS wage trends, was applied to project current 2026 compensation. Percentile ranges (P10–P90) represent the full salary distribution across experience levels and practice settings in this market.
Data Sources & Methodology
Source: BLS, OEWS, 7-year dataset (–). Per-city data from annual BLS metropolitan area surveys.
2026 figures are projected from 2025 BLS data using a compound annual growth rate (CAGR) of 2.46%, derived from historical BLS wage trends for physical therapists (SOC 29-1123).
Compiled and verified by Alex Morgan, DPT, a licensed physical therapist with 10+ years of clinical experience. · View source data at BLS.gov